Critical server alerts with HotHost: open-source quick-to-setup Disk/RAM notifier


There are a lot of server monitoring tools on the market but most of them are pretty slow to setup or provide a lot of unneded metrics which are not so important and only unfocus attention.
When any tech business grows to some level it could allow to invest a couple dozen hours in reliable setup of standalone monitoring system like Netdata or Zabbix. Such setup requires a competent operations engineer with a specific skills. Software development agencies like Devforth could easily implement it because they regularly have some free capacity on experienced operations engineers, who do similar work over the years, but a lot of bootstraping enterpreneurs still think that they will save money if they hire one or two hardworking full-stack freelancers which might underestimate the need of monitoring.
Anyway, for all projects on an early stages it is more important to reduce time-to-market and put all resources on features implementation. But if you are running software on VPS servers then you still need to be notified about upcoming critical issues on the live host which could be easily predicted, e.g. disk space is getting low or RAM memory is almost full.
So we think that someone might need simple enough tool to be installed anywhere by click of finger with minumum effort and notify about most critical issues only.
We implemented our PoC vision of monitoring simplicity in a free and open-source monitor called HotHost:

Main features:
- Get notified by Email/Slack/Telegram when host goes down or when available disk space / RAM is getting low.
- Get notification when state is recovered
- To set up the system, you need to run HotHost Web (docker container) on any host with public IP and setup SSL certificate. We will show simple steps on how to do it with CloudFlare and AWS EC2
- To add a host under monitoring you have to click plus button on the web and copy a simple console command (docker CLI or compose) snippet and run it on a target host
- In the end all monitoring components are self-hosted and free
- You can add as many hosts under monitoring as you need to one HotHost Web instance.
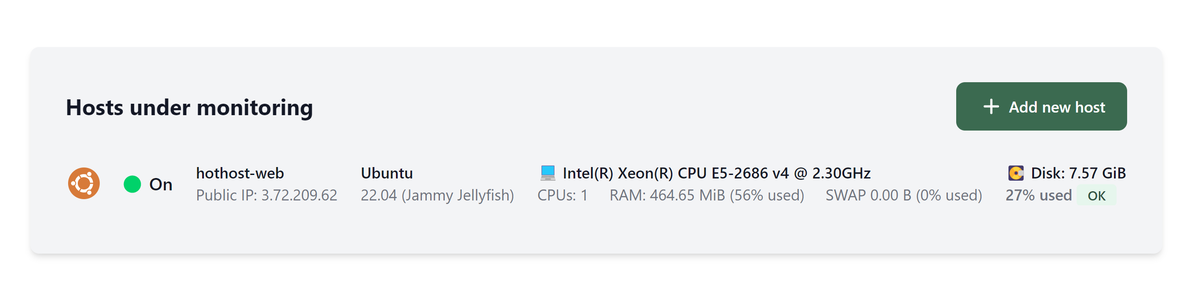
- On HotHost Web you can see generic info about hosts in one table: Hostname, public IP address, total and current number of RAM and Disk, processor model and a number of cores, swap size and whether it is enabled, the country where server is located.
- You can use existing plugins as an example to quickly create a new plugins (e.g to send SMS notifications or push real-time hosts metrics to some BI service)
In the cheapest case agent and server could be installed on the same machine (self-monitoring). It also makes sense because you still will be able to receive notifications about the lack of resources on this server.
From a security aspect, an agent works in read-only mode and sends metrics by simple HTTPs protocol (though you can set up HTTP but it is not recommended). For every new agent, we generate a random secret and ship it in the snippet. This secret does not allow to forge the metrics. Authorization of user on HotHost Web is performed via login form which uses "Strict" Cookie.
Step-by-step installation guide
We will use AWS EC2 to launch a web however you can use any VPS with a public IP.
Login into AWS Console, go to EC2 ➡️ Instances ➡️ Launch an instance, enter Name hothost-web.
1. Application and OS Images: Select Ubuntu 22.04 or later
2. Instance type: Smallest t2.nano instance would be enough.
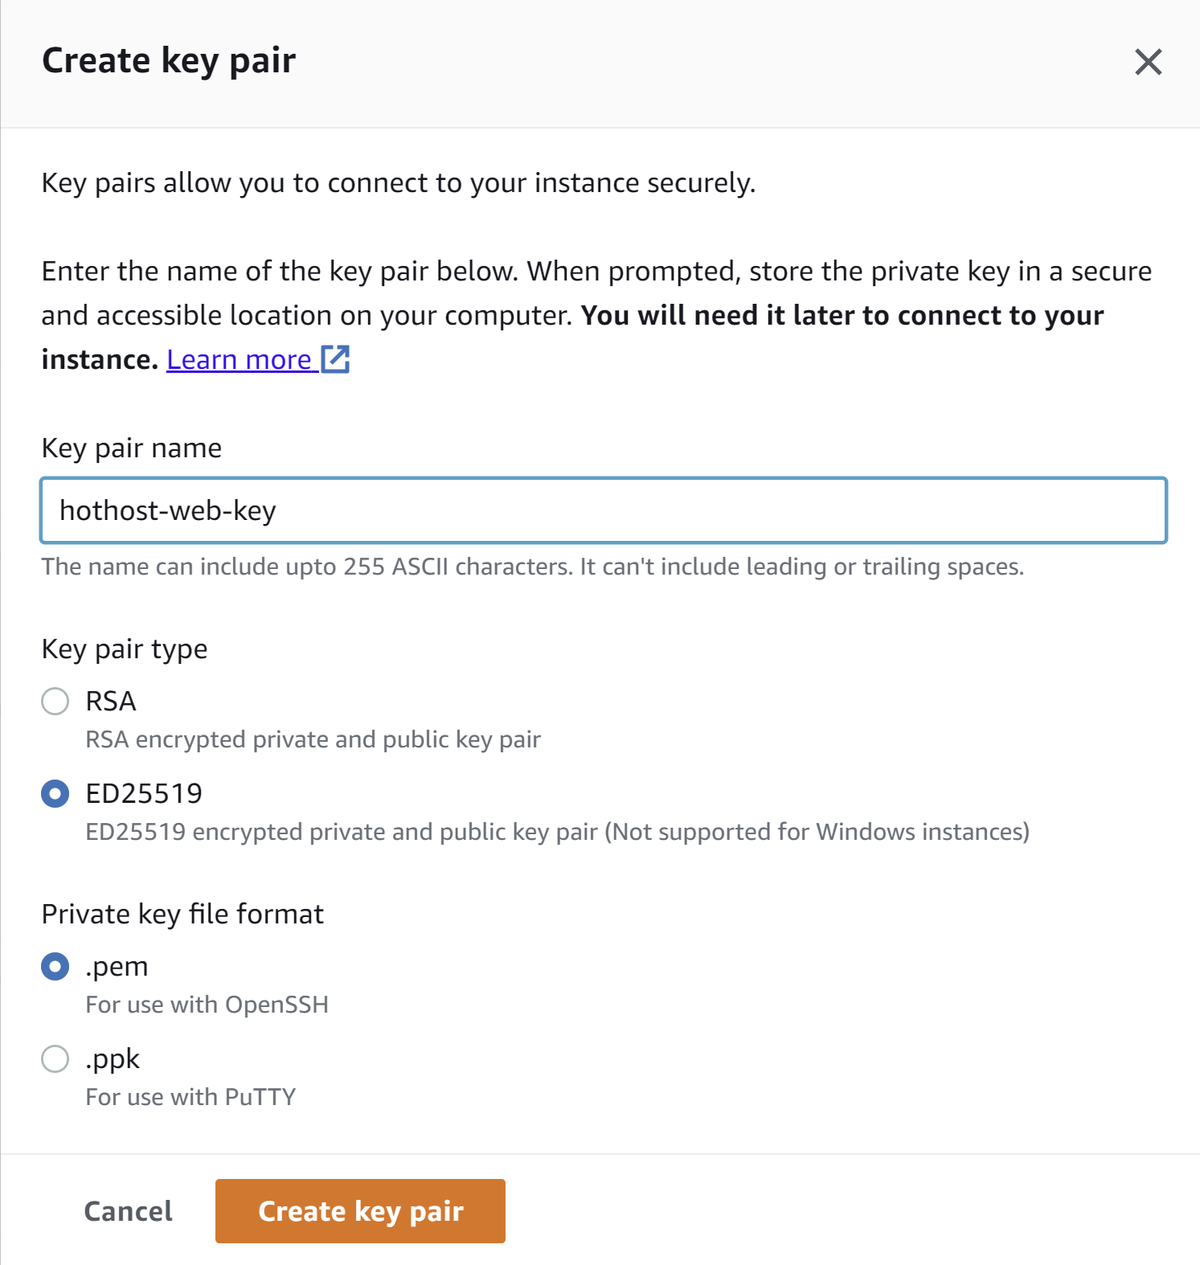
3. Key pair: Click Create new key pair. Save downloaded file because we will use it later to connect.
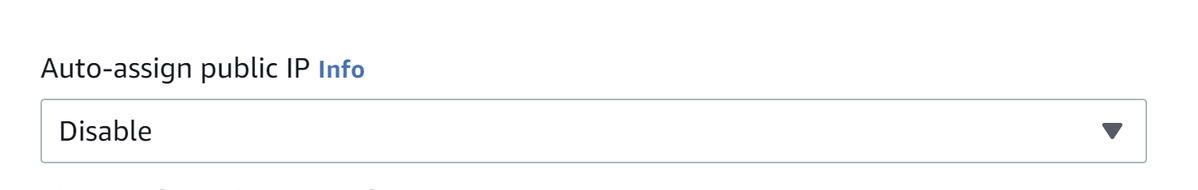
3. Under Network settings (Click Edit) disable IP address auto-assign (we will assign static Elastic IP later):
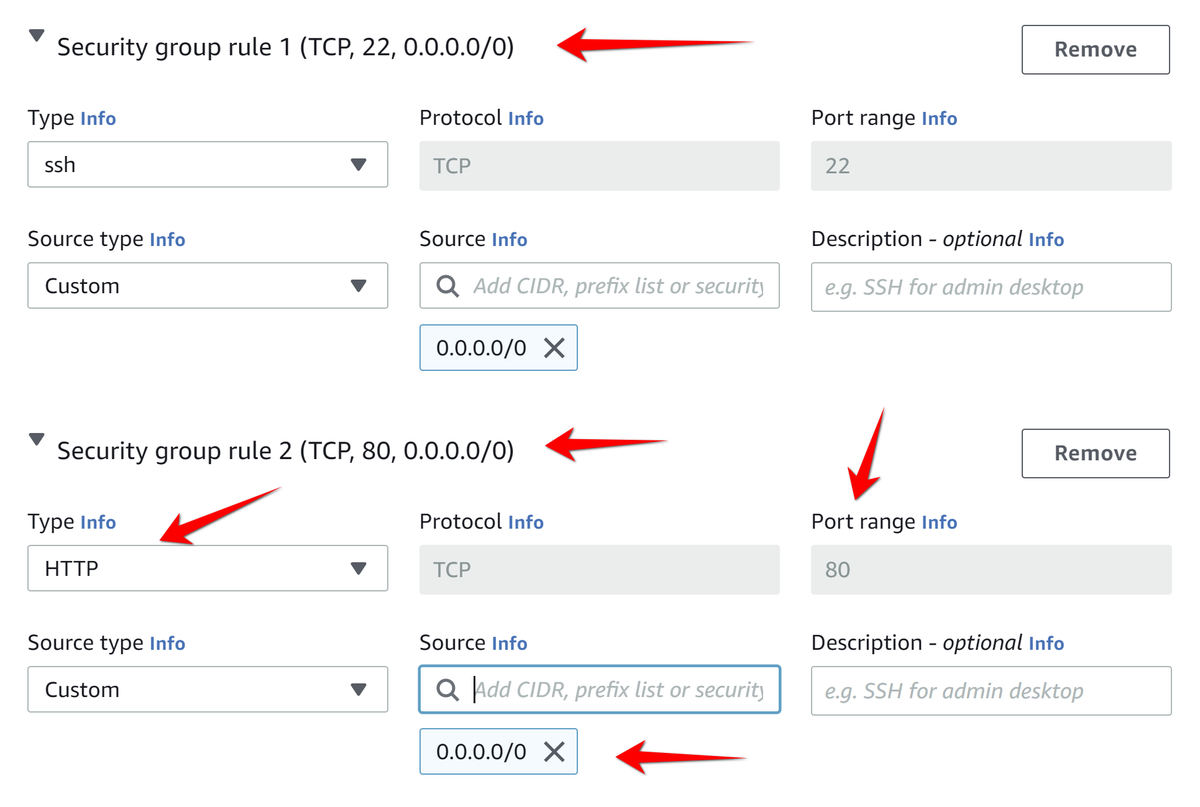
Also click Add security group rule and select HTTP to open port 80 in security groups:
4. Click Launch Instance
5. Go to EC2 ➡️ Elastic IP addresses ➡️ Allocate Elastic IP address, then Allocate. Click on the checkbox on the left side of the IP item you've just created, and click on Actions → Associate Elastic IP address to associate the IP address to EC2 instance, select instance and confirm action.
Return to EC2 ➡️ Instances, select instance and copy public IP address from Details tab:
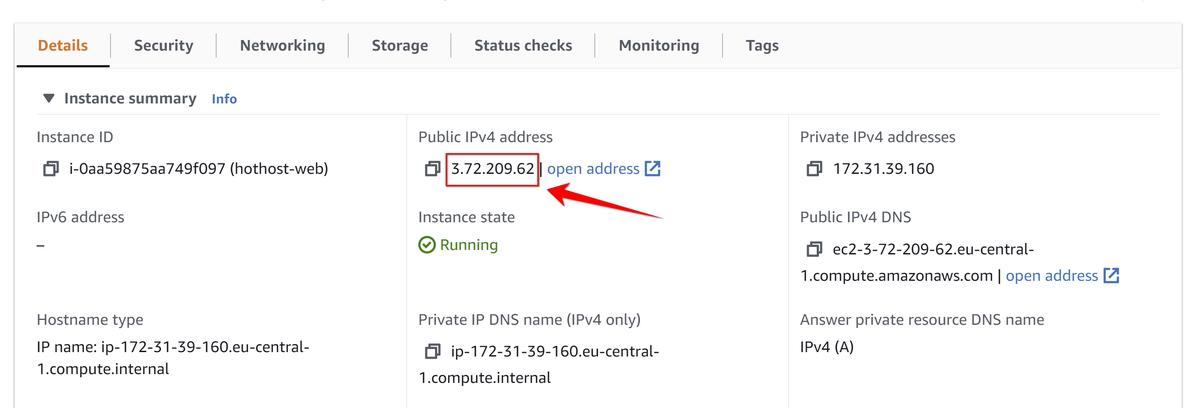
⚠️ Never share this IP to anyone, we will hide it using Cloudflare later. I will destroy this IP forever before publishing post
6. Go to any bash console (use WSL 2 on Windows) and execute SSH command passing key which you donwloaded above:
ssh -i ~/hothost-web-key.pem ubuntu@3.72.209.62
7. Edit hostname:
sudo nano /etc/hostname
Enter some clear name, for example hothost-web, save file by Ctrl+X
8. Now let's install docker to our host:
sudo apt update && sudo apt install -y docker.io
9. Now run next command which starts docker container:
sudo docker run -d --name=hothost-web \
  -v /www/hothostdata:/var/lib/hothost/data/ \
  --env HOTHOST_WEB_ADMIN_USERNAME=admin \
  --env HOTHOST_WEB_ADMIN_PASSWORD=theCoolVeryStroongPassword \
  --env HOTHOST_WEB_PORT=80 \
  --restart=always \
  -p 80:80 \
  devforth/hothost-web
If you wish, you can check status of started container by running:
sudo docker ps
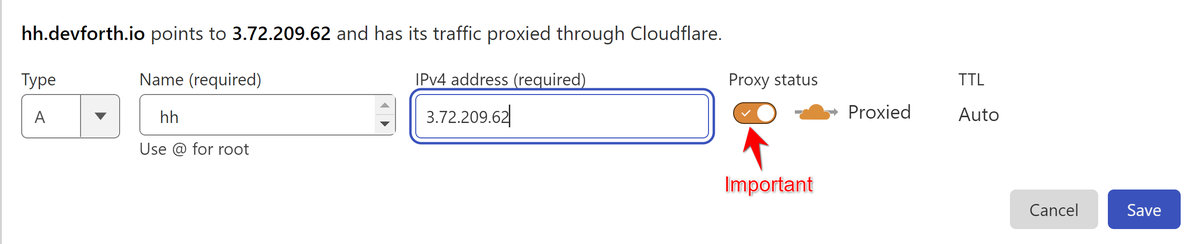
Now it is time to connect Cloudflare to terminate SSL (HTTPs) traffic. You can add an etire domain to Cloudflare or create subdomain on existing one. For example I have devforth.io added to Cloudflare so I will serve hothost on https://hh.devforth.io.
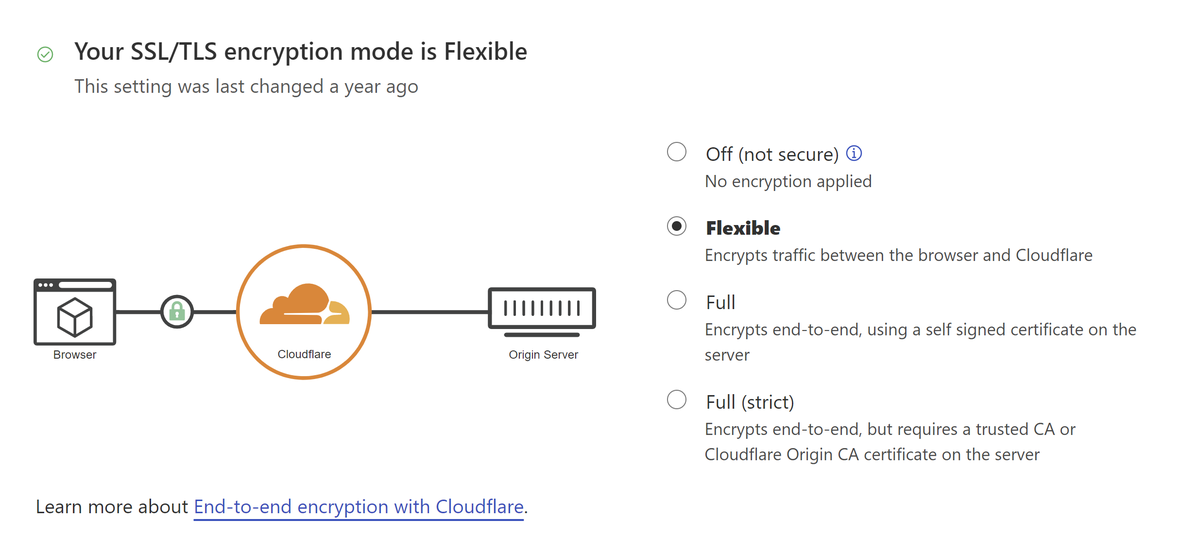
Also make sure you are using Flexible SSL/TLS mode. You can check it in SSL/TLS ➡️Overview. This option enables user to use HTTPS to access hothost web (SSL is terminated on Cloudflare side) but Cloudflare will connect upstream using port 80 on which our docker container is listening.
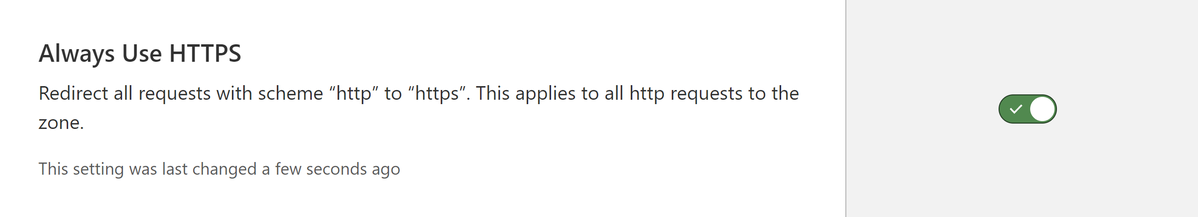
Also we recommed setting "Always Use HTTPS" to automatically redirect user from HTTP to HTTPS if they use it:
📒 Please note, that if you are using Cloudflare on existing domain which also used to proxy traffic to other upstreams then last two options might create some incompatibilities with your existing upstreams. You can create some new domain or adjust your upstreams
You should see login form:
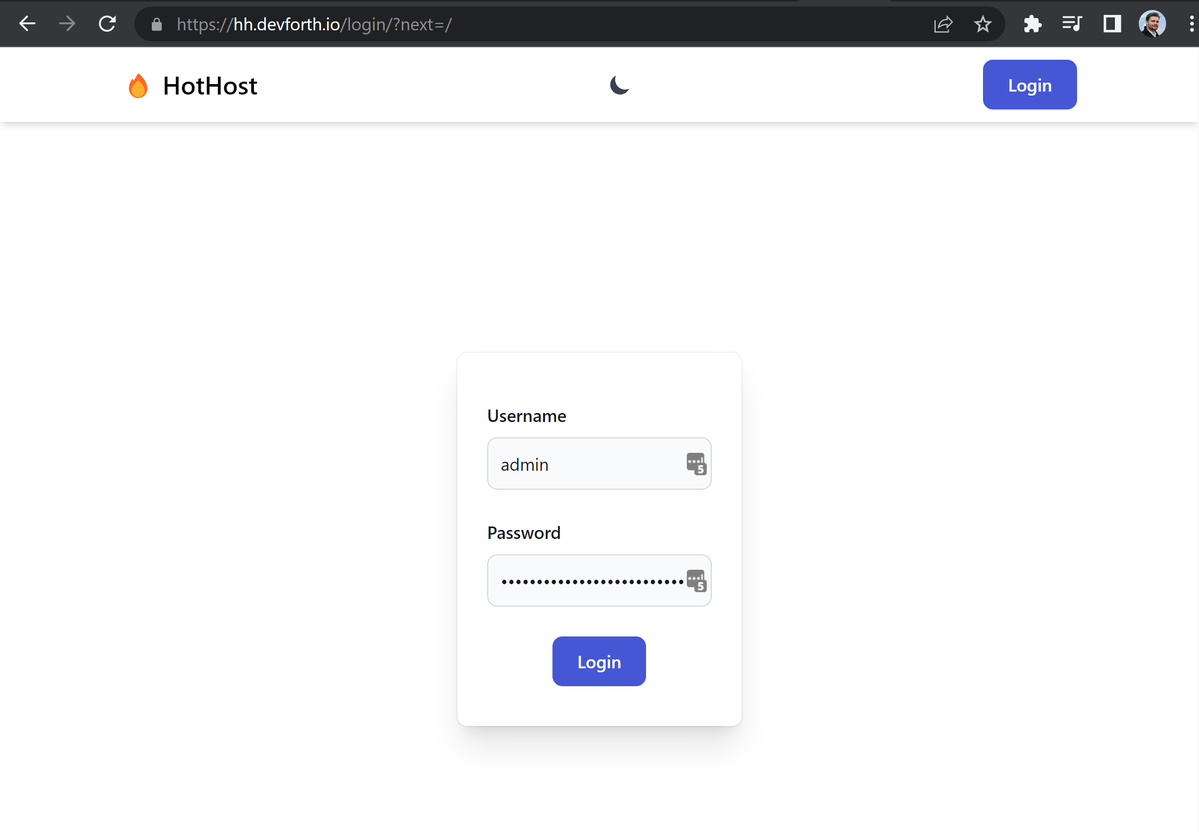
Enter your login and super strong password, you should get inside.
Adding an agent
Click Add new host button. You should instantly get fast code snippets:
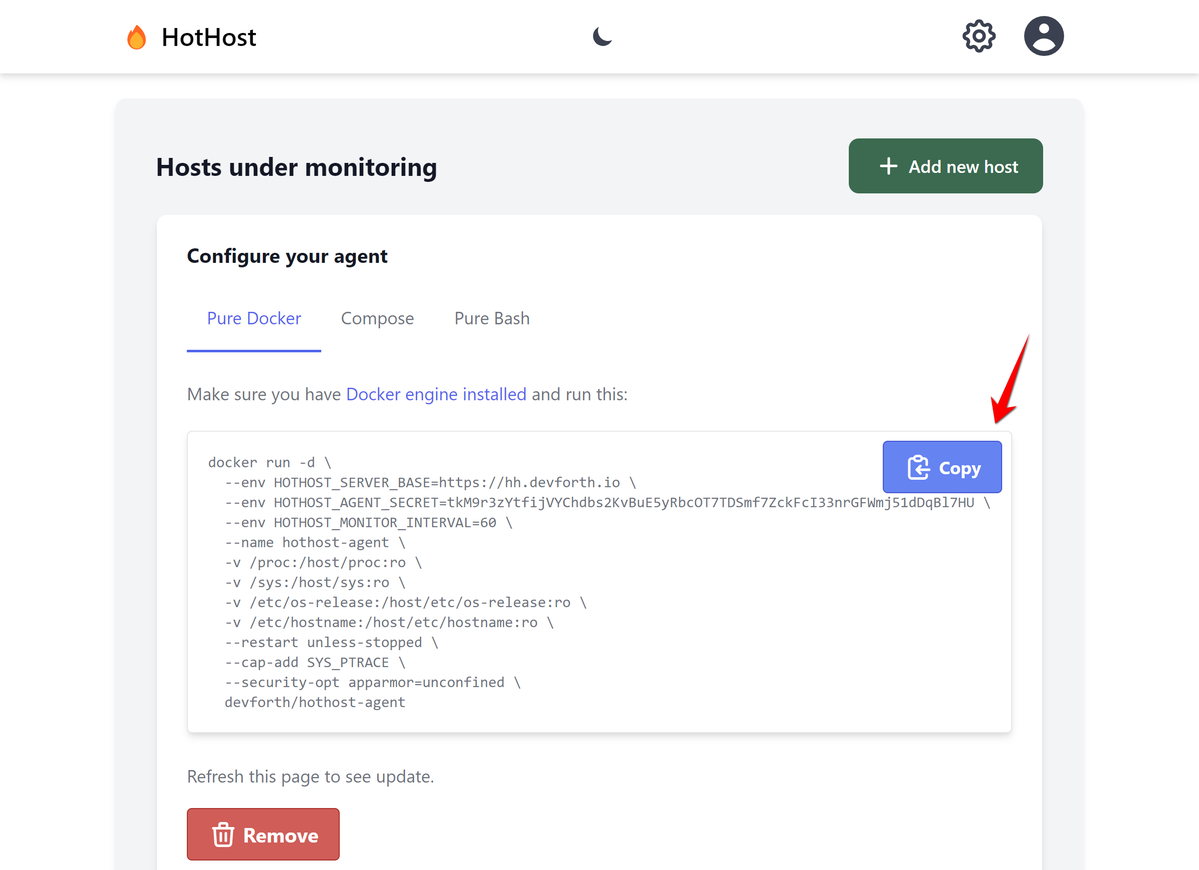
Let's use Pure docker to install agent on same host which runs server (self-monitoring). Just click Copy, and paste it into SSH console on same server. You might also need to add sudo (Ctrl+A, type sudo). After page refresh you should see host:
Setting up notifications
Go to Settings➡️Plugins:
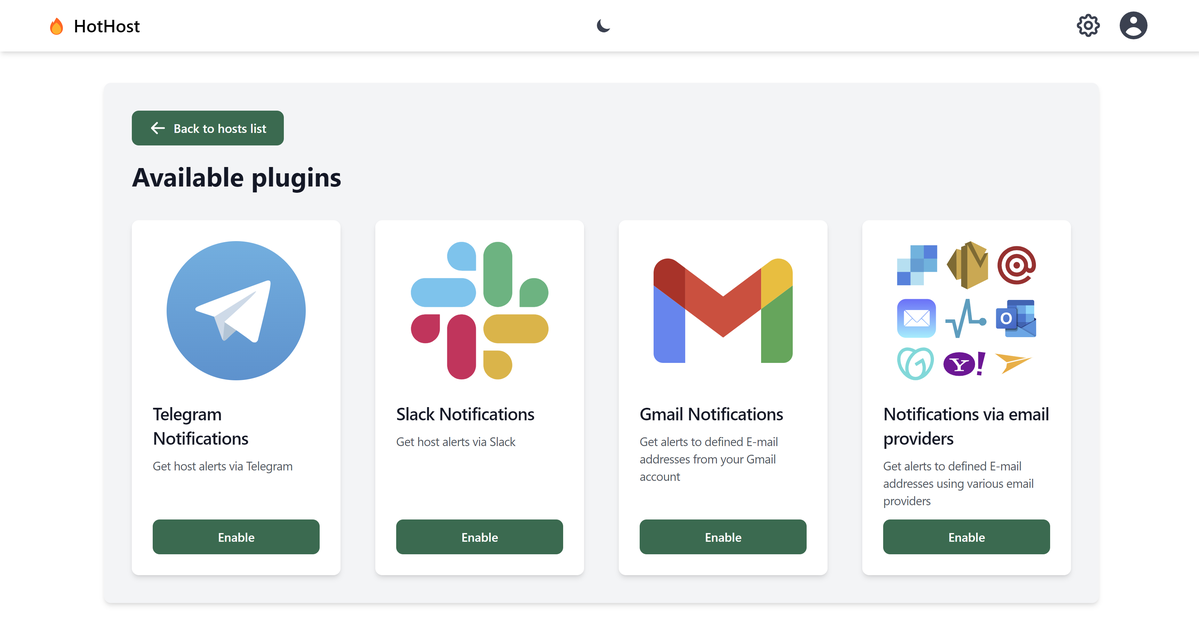
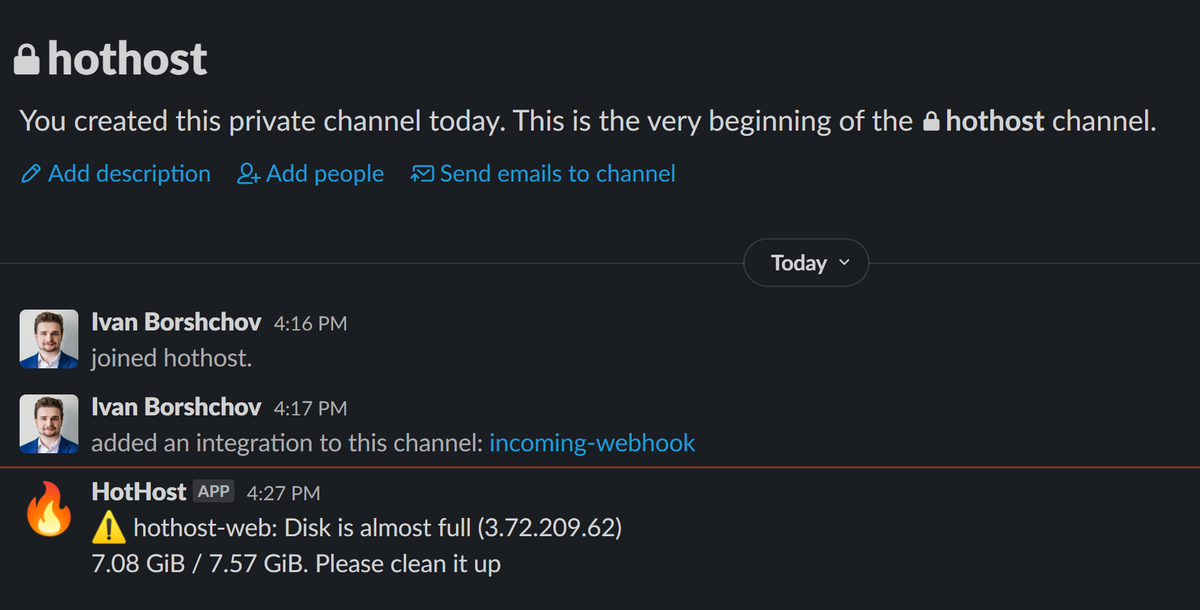
For example let's setup Slack notifications. Click On green Enable Button.
You will get detailed guide how to add Slack Webhook into your workspace:
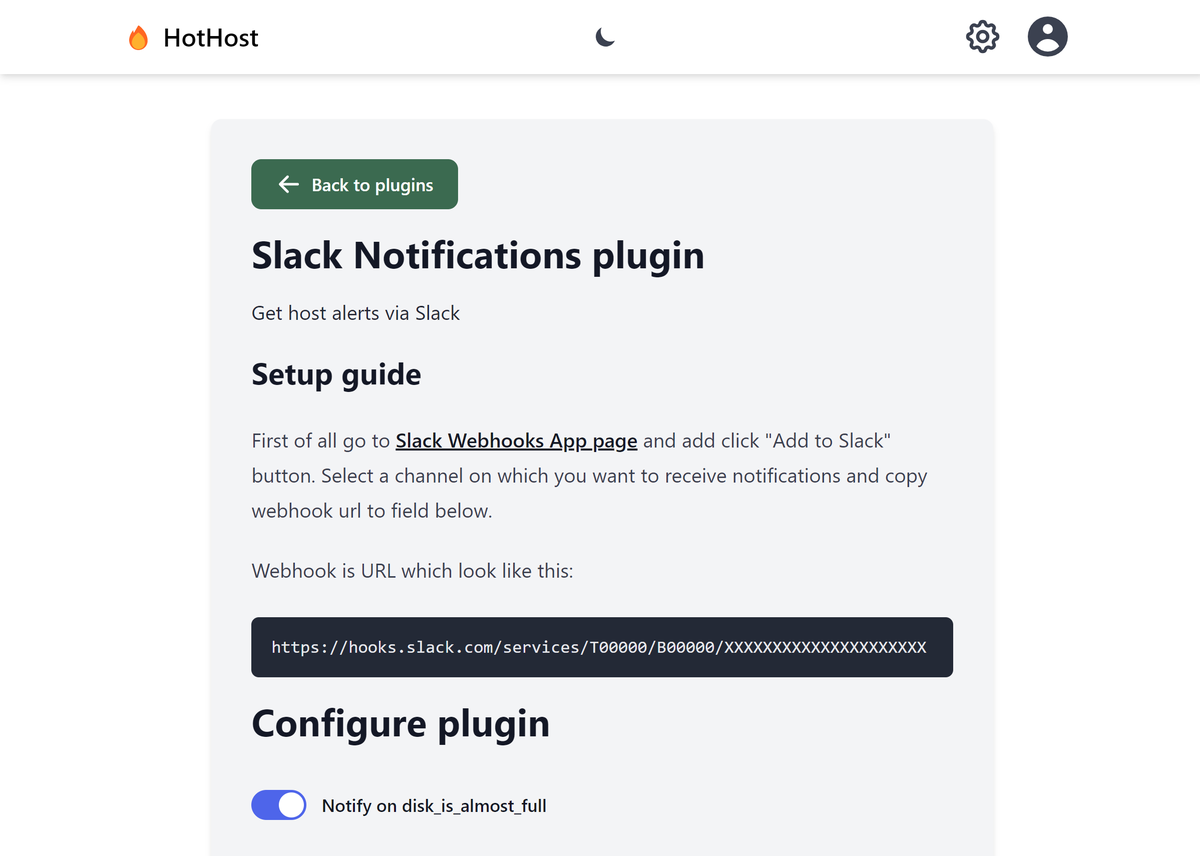
Fill Webhook setting, scroll down and click Enable Plugin.
To reproduce issue you can allocate some large file, e.g. I did fallocate -l 5G file1
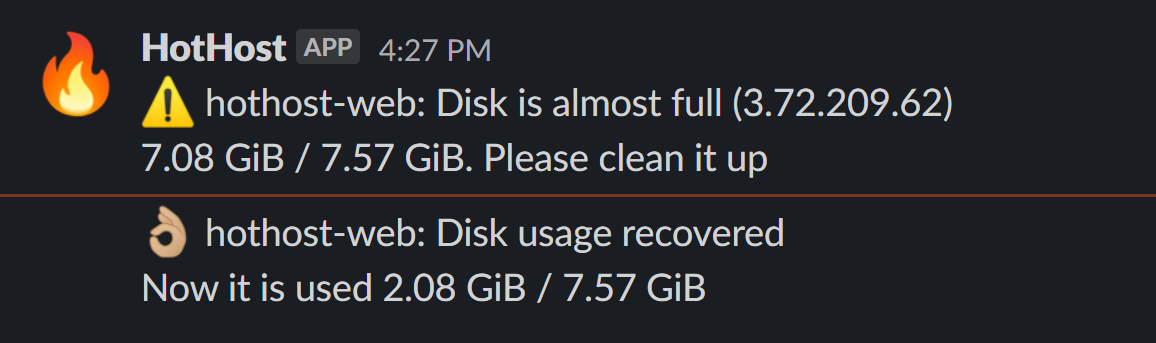
And received next norification in Slack:
After removing file you will get inverted "Ok" notification:
In same way you can add Email or Telegram notifications.
Usefull links