Chrome remote debugging setup


Chrome Remote Debugging Protocol (CRDP) is a protocol that is used to view and interact with tabs and DevTools of one browser in another browser (probably remote). This protocol allows us to run some Chrome processes in a headless mode somewhere on the server, and access to this browser from local machine. Headless Chrome/Chromium instance is widely used in various automated testing frameworks like Cypress or Playwright or scraping tools like Puppeteer.
CRDP is pretty easy in use, and here we will prove you this by showing simple actions to set it up.
Start with installing Chromium on the server. For test, you can run it on local machine.
If you have Ubuntu you can use:
sudo apt install chromium
sudo snap install chromium
Then run Chromium in headless mode (on remote server or locally if you want just test it):
chromium-browser --headless --remote-debugging-port=9222 --headless --no-sandbox --remote-allow-origins=* https://google.com
If you are running chromium-browser on server, then proxy port using SSH. Run this code on your local machine in terminal and keep it open to persist remote port forwarding:
ssh -L 922:localhost:9222 remote_user@remote_host_ip
Instead of port tunneling you can just open the port on your instance/firewall, but we strictly recommend always closing all unneeded ports to the world. For most apps only :22 (SSH) and :80/:443 (HTTP) are needed to operate, the rest must be closed by a hardware firewall (like Security Group in Amazon EC2) or if your hoster does not have a dedicated firewall use software firewall running on server OS, we recommend UFW
Now open http://localhost:922/json on your local machine. If you want to test remote debugging feature locally just go to http://localhost:9222/json.
Replace /json in URL with the value of devtoolsFrontendUrl.
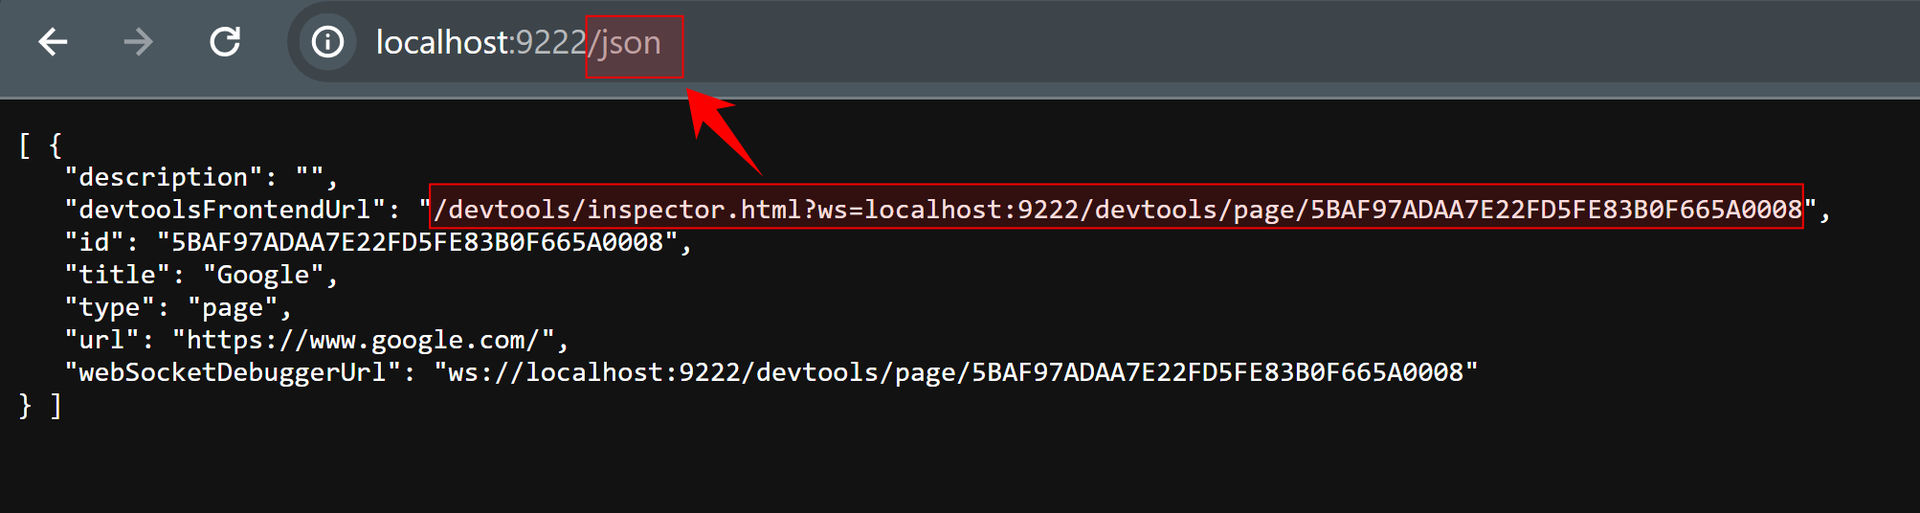
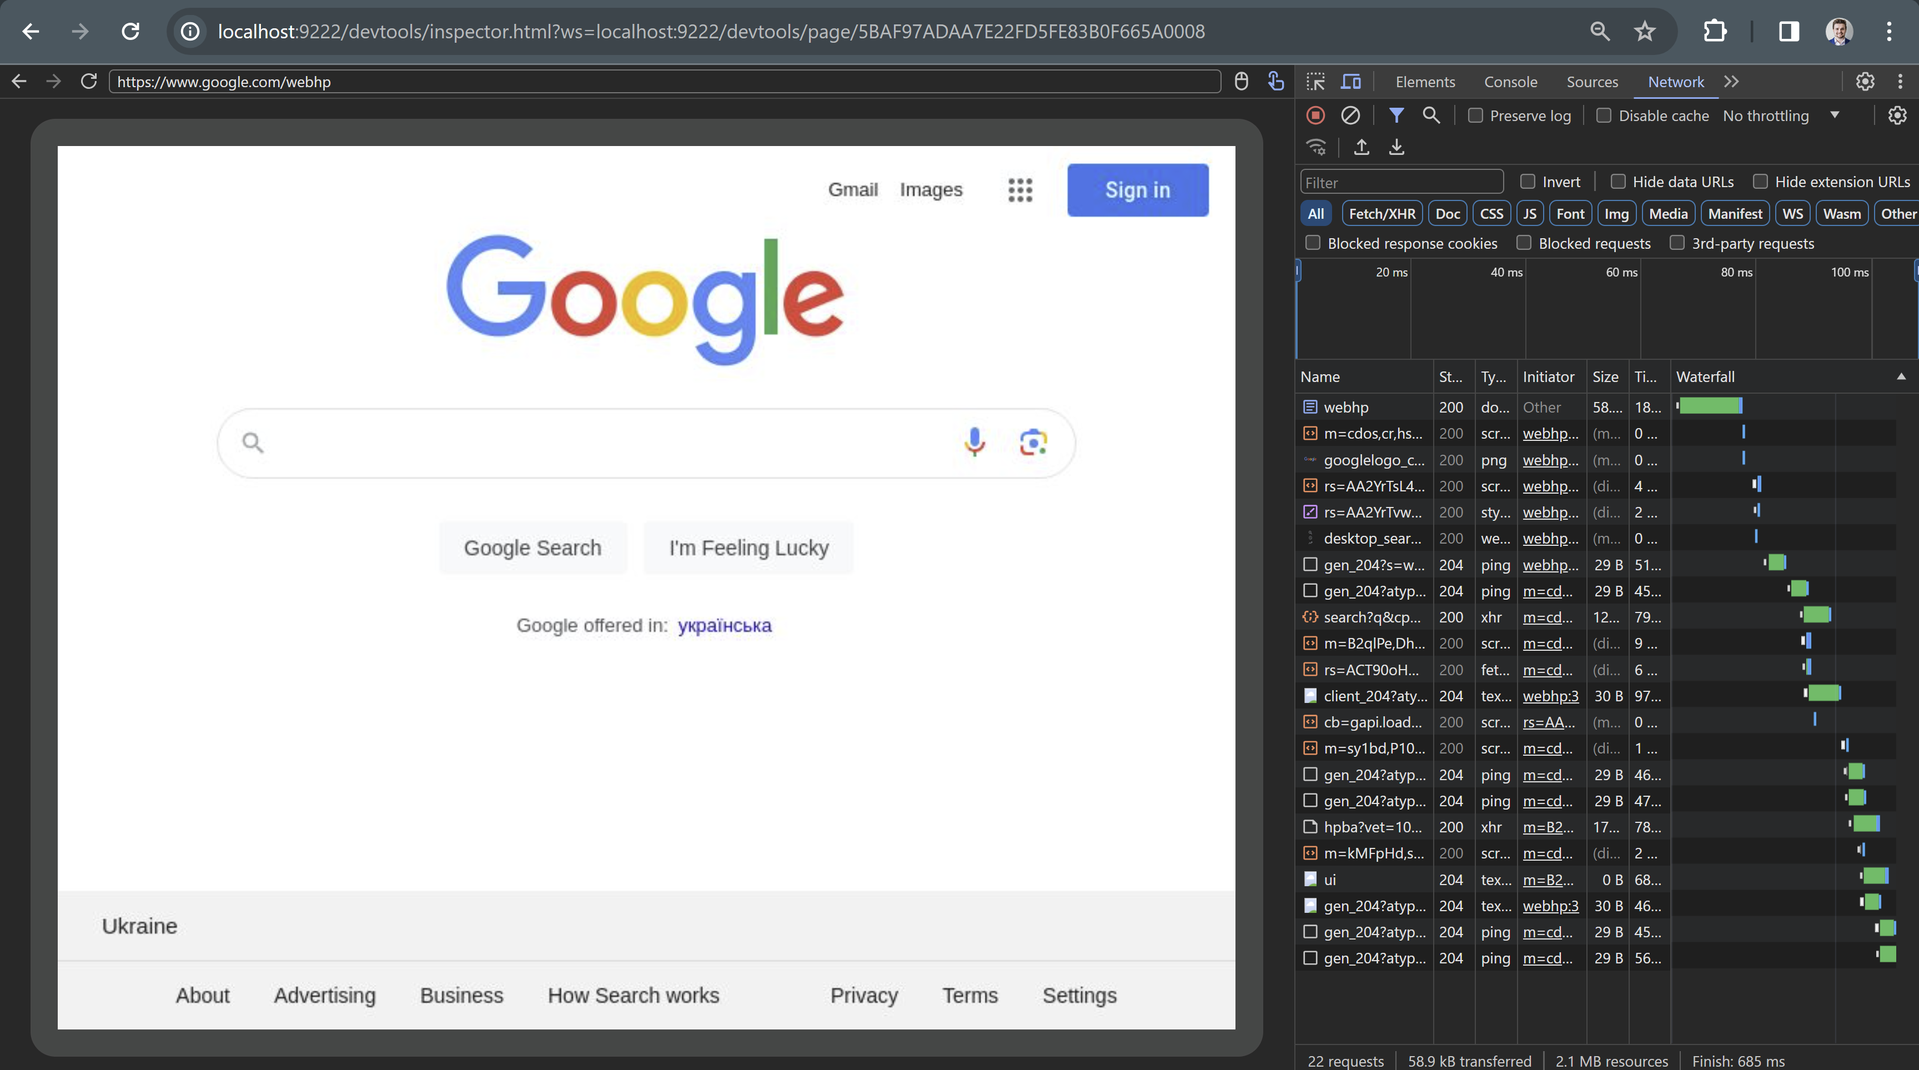
And here you will see a nested window from remote headless browser:
In the past, CRDP worked just by visitinghttp://localhost:9222/in your browser and then being allowed to select a window to debug. But in recent versions of Chromium/Chrome we see that root page is blank, and we have to go to/jsonfirst and concatenate thedevtoolsFrontendUrlURL manually
Also you can use Chrome Remote Debugging Protocol when you are debugging puppeteer:
const browser = await puppeteer.launch({
  headless: true,
  args: ['--remote-debugging-port=9222',  '--no-sandbox', '--remote-allow-origins=*'],
  dumpio: true, // Enable logging of browser's stdout and stderr
});
Hope this post helped you!