
Claude Code /usage significantly overestimates output tokens
Claude Code’s local /usage may be inflating output tokens by millions. We traced JSONL duplicates and live HTTPS traffic to find what’s really happening.
Observed in Claude Code 2.1.195 on Linux (latest claude CLI I had on June 28, 2026).
I ran into this while building LetMeCode, a CLI tool we are developing at devforth to estimate API-equivalent cost across different coding agents.
My first guess was that LetMeCode was deduplicating too aggressively, and that Claude's own stats were the real ground truth.
So I started by trying to prove my own tool wrong.
After going through real ~/.claude/projects/*.jsonl transcripts and then capturing live Claude traffic over HTTPS, I changed my mind:
Claude Code's local stats seem to overcount output tokens by summing repeated cumulative usage snapshots from local transcript rows.
TL;DR
For Opus 4.8, Claude's CLI local stats (/usage command) showed:
In: 669.7kOut: 5.1m
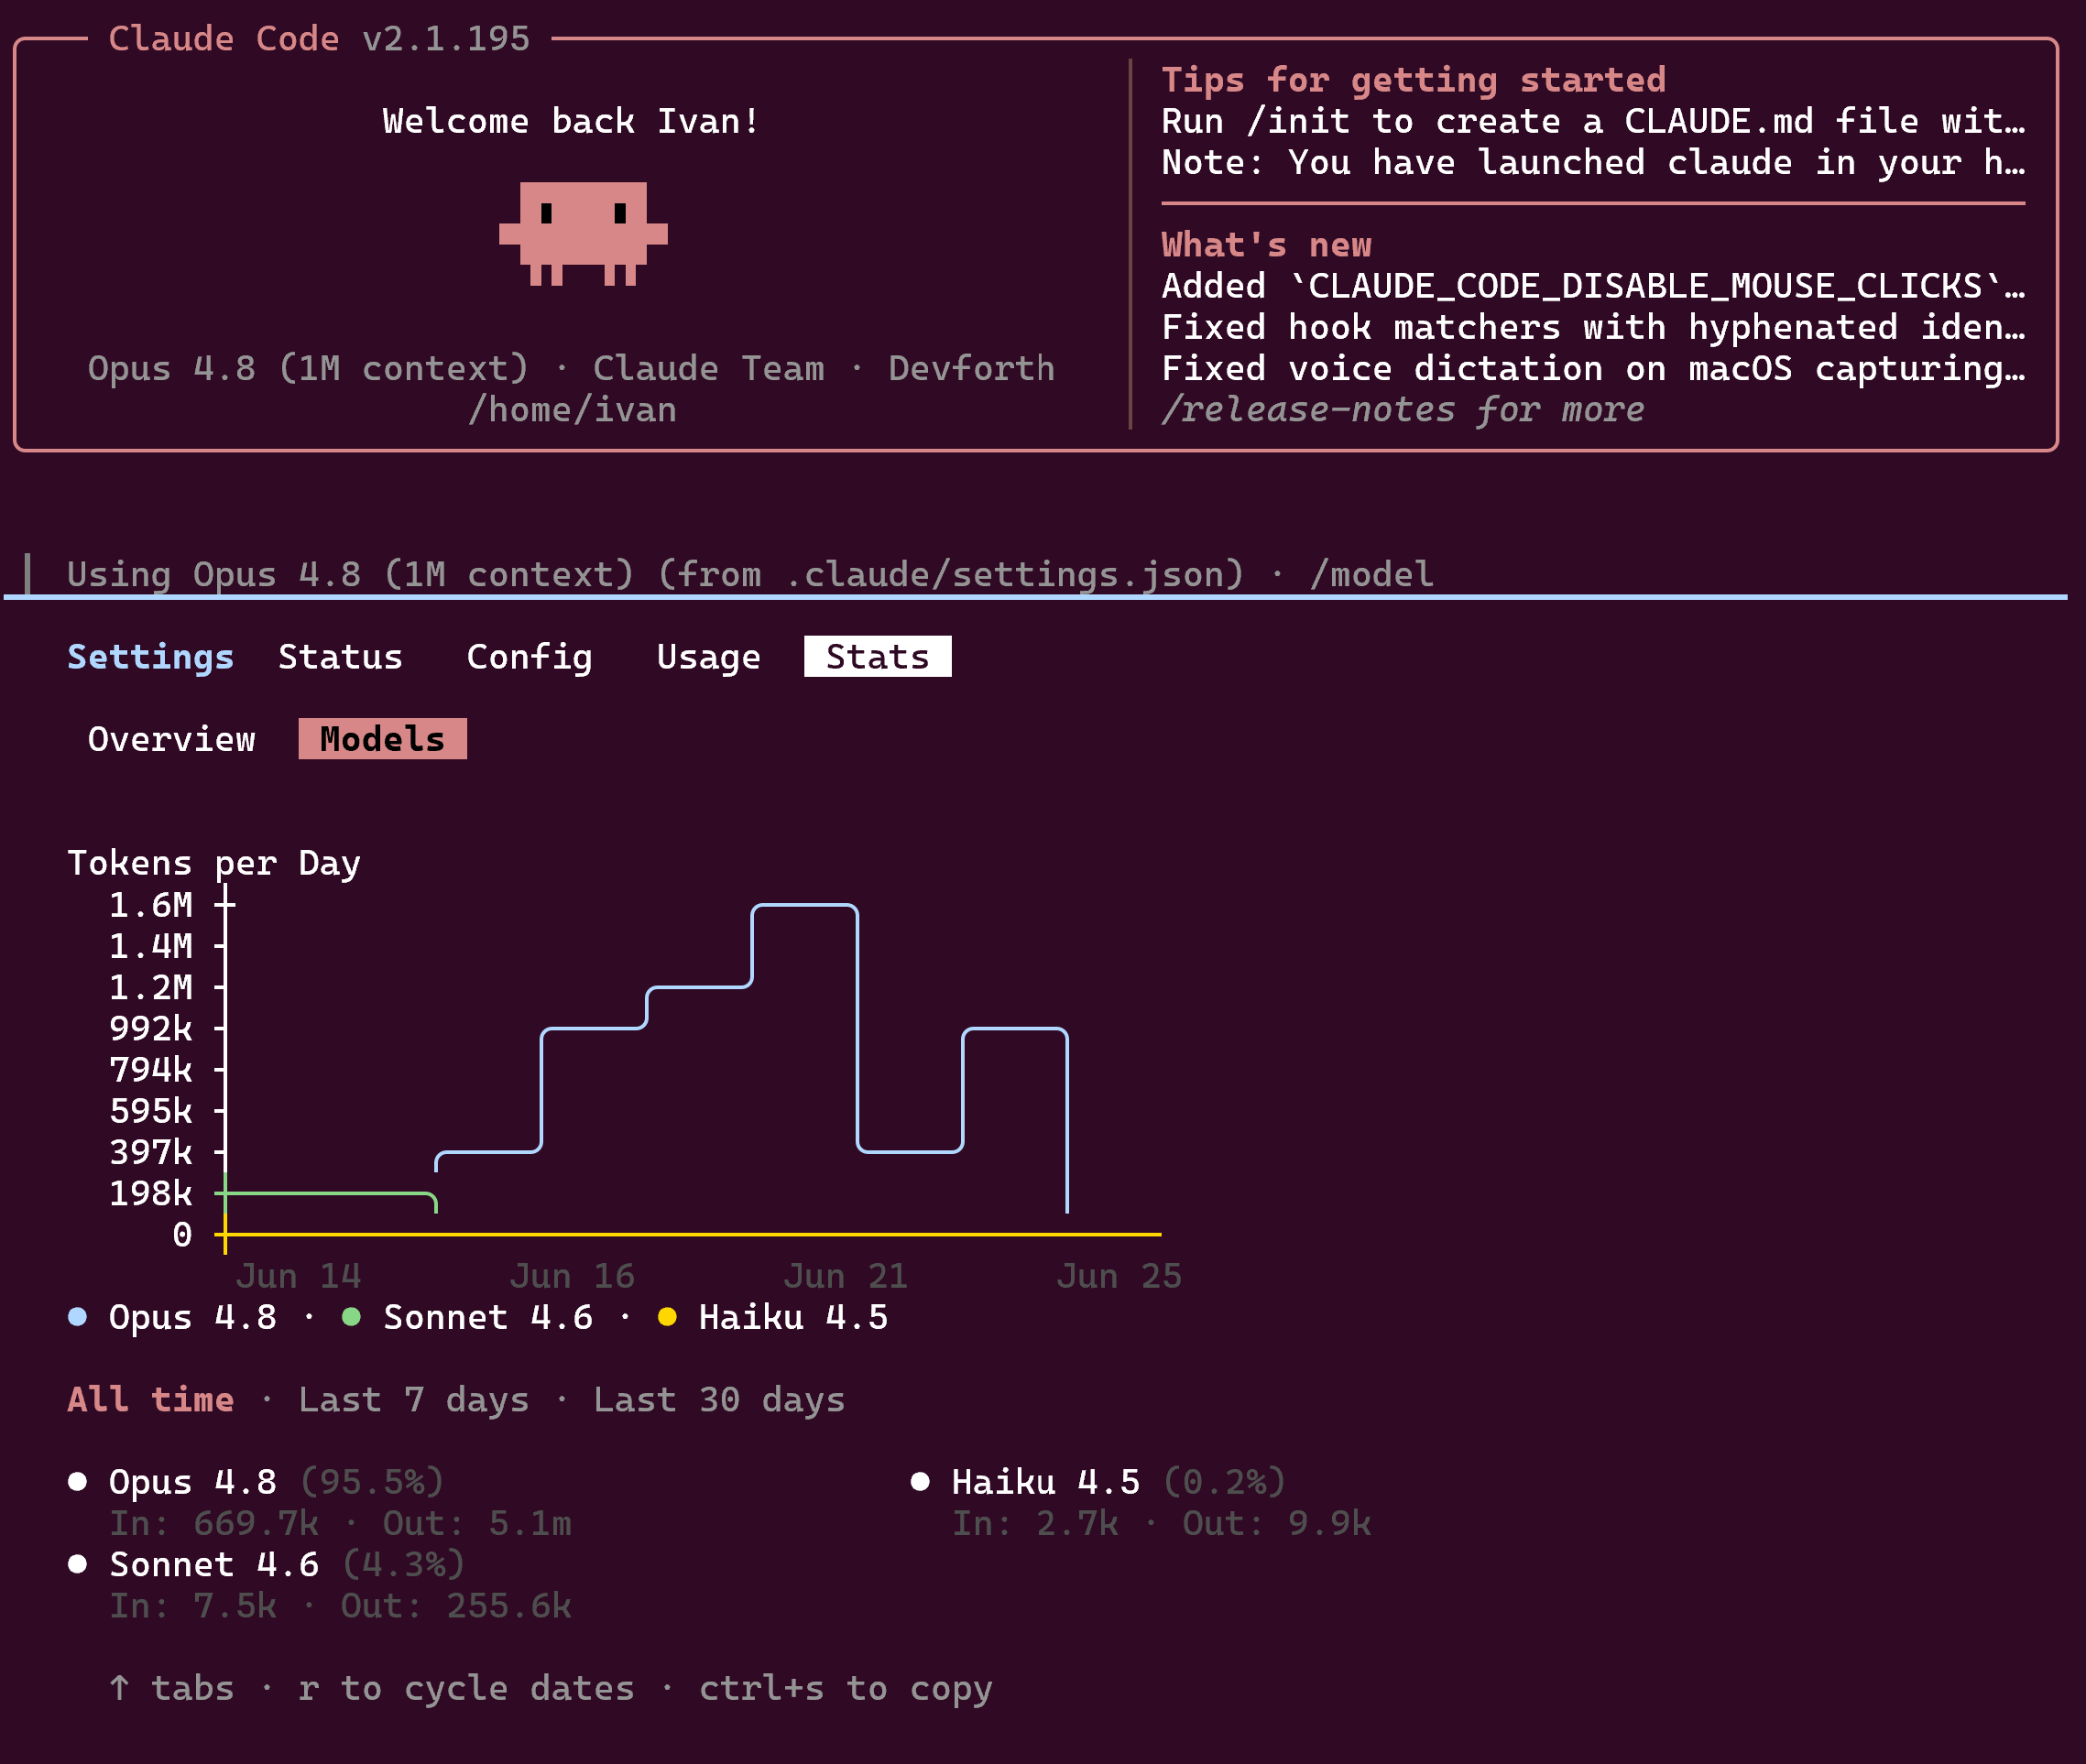
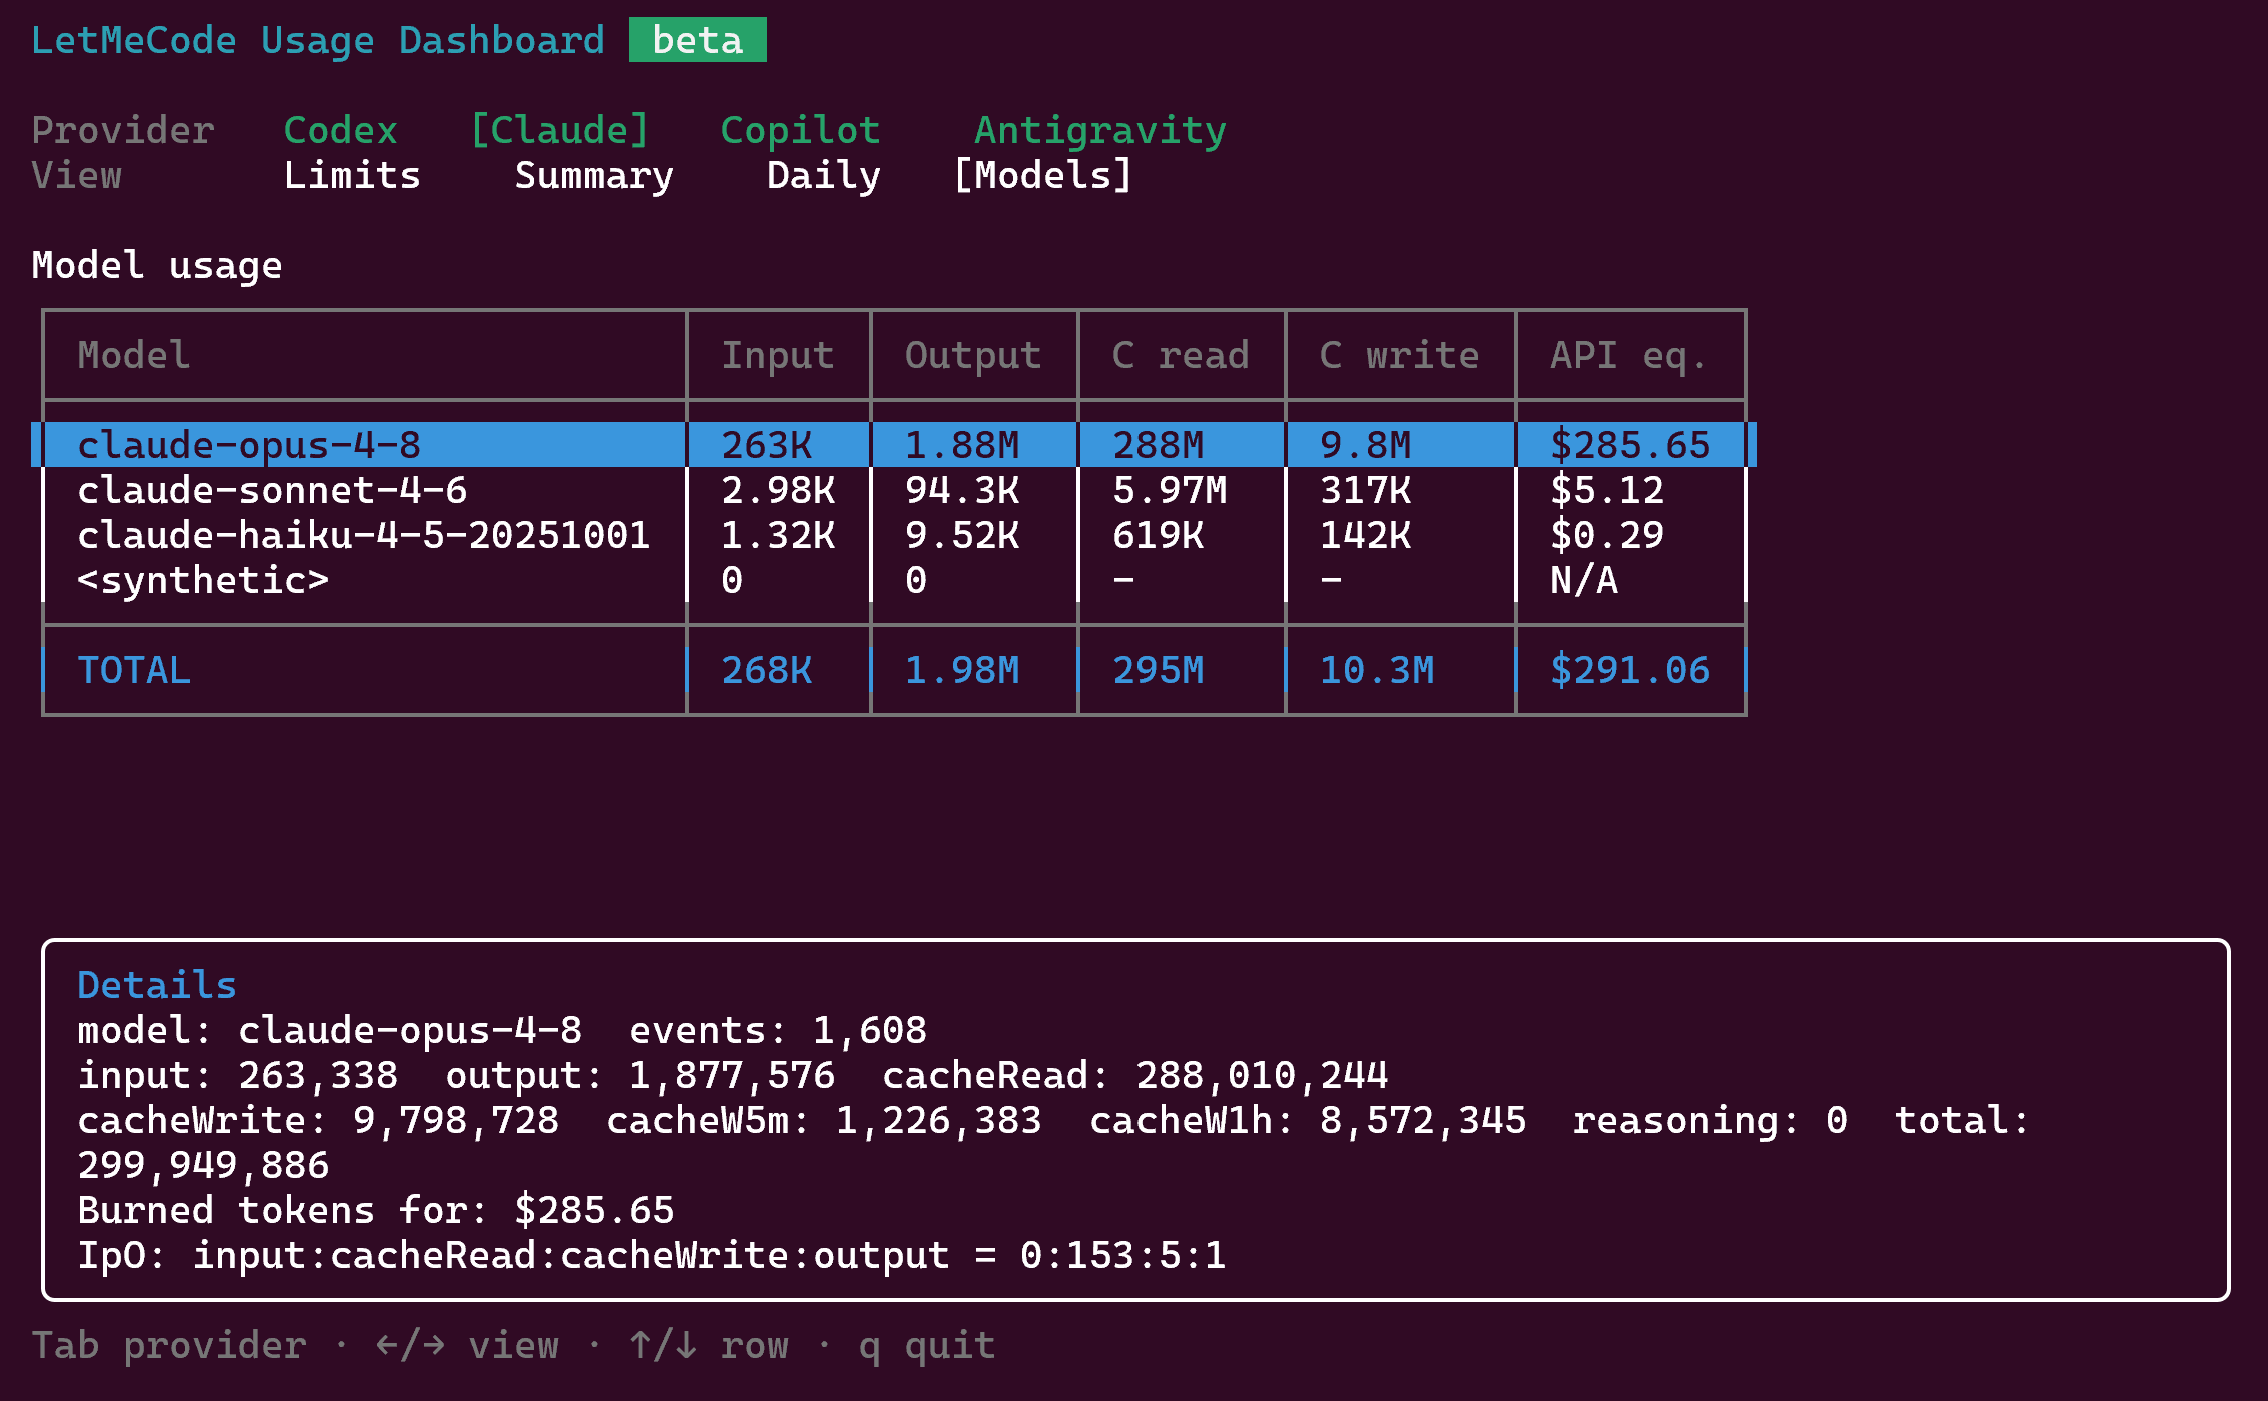
LetMeCode, after deduplicating repeated rows, showed about:
Input: 263KOutput: 1.88M
The number I could not explain was the output side: 5.1M vs 1.88M.
Here is what I found:
- If you manually sum raw
output_tokensfrom the local transcript scope that matches/usagein this snapshot, you get exactly Claude's local/usagenumber. - Those local transcript rows contain large groups of exact duplicate usage snapshots with the same
requestId, samemessage.id, same token counts. - A real tool-using Claude run, captured over HTTP, produces new request IDs for new model inference API calls.
- A single real API response streams cumulative usage (
message_start, thenmessage_delta) and not separate billable outputs. - I also checked
subagents/workflowsseparately. In my local data they were only about73kOpus output tokens, and excluding them is what makes the raw sum match Claude/usage1.
My current read is: Claude's local counter matches raw transcript rows, but raw transcript rows are not the same thing as distinct model generations or real API calls.
Once those pieces are next to each other, I do not see a good case that all 5.1M output tokens were distinct generated output.
The first number that bothered me
The number visible in /usage appears to come from ~/.claude/stats-cache.json. My local stats cache says this for Opus 4.8:
"claude-opus-4-8": {
  "inputTokens": 661098,
  "outputTokens": 5105724,
  "cacheReadInputTokens": 665239304,
  "cacheCreationInputTokens": 25503472,
  "webSearchRequests": 0,
  "costUSD": 0
}
Now look at this raw sum over local transcripts, excluding subagents/workflows:
I checked subagents/workflows separately because that is an obvious question. In my local data it contained only 257 Opus rows and 73,799 Opus output tokens. More importantly, those rows do not appear to be counted in Claude's /usage number: once I exclude them, the raw transcript sum matches stats-cache.json 1
1.88M.
python - <<'PY'
import json
from pathlib import Path

base = Path.home() / ".claude/projects"
output_sum = 0
input_sum = 0
count = 0

for path in base.rglob("*.jsonl"):
    if "subagents/workflows" in str(path):
        continue
    for line in path.read_text().splitlines():
        if not line.strip():
            continue
        row = json.loads(line)
        msg = row.get("message") or {}
        usage = msg.get("usage") or {}
        if msg.get("model") == "claude-opus-4-8":
            output_sum += usage.get("output_tokens", 0) or 0
            input_sum += usage.get("input_tokens", 0) or 0
            count += 1

print({"rows": count, "input_tokens": input_sum, "output_tokens": output_sum})
PY
Output:
{'rows': 3663, 'input_tokens': 661098, 'output_tokens': 5105724}
So Claude's local stats do not seem to be pulling a separate server-side total here.
They match the raw local transcript sum, which is the same 5.1M reported by /usage.
And that raw local transcript sum is exactly where the trouble starts.
Exact duplicate usage rows
Here is a real duplicate group from one Opus transcript:
python - <<'PY'
import json
from pathlib import Path
from collections import defaultdict

path = Path(
    "~/.claude/projects/-home-ivan-code-devforth-portal/"
    "42213d22-0d82-4947-837c-904d7564c8f8.jsonl"
).expanduser()

groups = defaultdict(list)
for idx, line in enumerate(path.read_text().splitlines(), start=1):
    if not line.strip():
        continue
    row = json.loads(line)
    msg = row.get("message") or {}
    if msg.get("model") != "claude-opus-4-8":
        continue
    usage = msg.get("usage") or {}
    key = (
        row.get("requestId"),
        msg.get("id"),
        usage.get("input_tokens"),
        usage.get("cache_read_input_tokens"),
        usage.get("cache_creation_input_tokens"),
        usage.get("output_tokens"),
    )
    groups[key].append((idx, row))

items = [(k, v) for k, v in groups.items() if len(v) >= 10]
items.sort(key=lambda kv: len(kv[1]), reverse=True)
key, rows = items[0]

print("count", len(rows))
print("key", key)
for idx, row in rows[:10]:
    kinds = [block.get("type") for block in (row.get("message") or {}).get("content", [])]
    print(idx, row.get("timestamp"), kinds)
PY
Output:
count 22
key ('req_011CcCxfQ8WYjyurTAc1wN3z', 'msg_01QeJVW4jBZephe2HTctHVRb', 2, 84236, 1395, 6889)
67 2026-06-19T16:48:50.556Z ['thinking']
68 2026-06-19T16:48:51.034Z ['text']
69 2026-06-19T16:48:53.199Z ['tool_use']
70 2026-06-19T16:48:54.862Z ['tool_use']
71 2026-06-19T16:48:56.741Z ['tool_use']
75 2026-06-19T16:49:03.290Z ['tool_use']
76 2026-06-19T16:49:03.621Z ['tool_use']
77 2026-06-19T16:49:03.785Z ['tool_use']
78 2026-06-19T16:49:04.964Z ['tool_use']
81 2026-06-19T16:49:06.919Z ['tool_use']
Same requestId.
Same message.id.
Same exact usage:
input_tokens = 2cache_read_input_tokens = 84236cache_creation_input_tokens = 1395output_tokens = 6889
In other words, all 22 rows claim to describe the same request and the same assistant message.
Repeated 22 times across thinking, text, and many tool_use rows.
If you raw-sum those rows, you get:
6889 * 22 = 151,558 output tokensThat does not look like 22 separate model generations.
That looks like one cumulative usage snapshot getting copied into multiple transcript rows.
It was not just one example
When I counted exact duplicate Opus groups in local transcripts, I got:
python - <<'PY'
import json
from pathlib import Path
from collections import defaultdict

base = Path.home() / ".claude/projects"
groups = defaultdict(list)

for path in base.rglob("*.jsonl"):
    if "subagents/workflows" in str(path):
        continue
    for line in path.read_text().splitlines():
        if not line.strip():
            continue
        row = json.loads(line)
        msg = row.get("message") or {}
        usage = msg.get("usage") or {}
        if msg.get("model") != "claude-opus-4-8":
            continue
        req = row.get("requestId")
        mid = msg.get("id")
        if not req or not mid or not usage:
            continue
        sig = (
            req,
            mid,
            usage.get("input_tokens"),
            usage.get("cache_read_input_tokens"),
            usage.get("cache_creation_input_tokens"),
            usage.get("output_tokens"),
        )
        groups[sig].append(row)

identical_groups = 0
identical_events = 0
identical_delta = 0
for sig, rows in groups.items():
    if len(rows) < 2:
        continue
    identical_groups += 1
    identical_events += len(rows)
    identical_delta += sig[5] * (len(rows) - 1)

print({
    "identical_groups": identical_groups,
    "identical_events": identical_events,
    "identical_output_delta": identical_delta,
})
PY
Output:
{
  'identical_groups': 1045,
  'identical_events': 3042,
  'identical_output_delta': 3300770
}
That means 3.30 million Opus output tokens disappear if you remove only exact duplicate same-request, same-message, same-usage repeats.
No fuzzy matching, no judgment calls. Just exact duplicates.
I also reran this duplicate check with subagents/workflows included. In my current local files, that changed the duplicate-output delta by only 450 tokens, so the duplicate pattern is not coming from that folder either.
"But maybe one request ID can still hide many real API calls?"
That was the best counterargument I could think of. If it were true, the duplicate rows might still be legitimate.
Maybe the agent makes multiple billable model calls during one logical turn, and Claude reuses the same requestId or message.id.
So I stopped guessing and looked at the actual traffic.
How I captured Claude Code's HTTPS traffic
I wanted to answer two basic questions:
- Does one logical tool-using turn map to one real
/v1/messagescall, or many? - When Claude makes a new real model call, does it get a new request ID?
Plain Wireshark is not enough here because Claude talks to Anthropic over TLS.
So I ran Claude through a trusted MITM proxy:
- Run
mitmdumpin Docker. - Let it generate its own CA certificate.
- Tell Claude to trust that CA via
NODE_EXTRA_CA_CERTS. - Force Claude through the proxy using
HTTPS_PROXYandCLAUDE_CODE_HTTPS_PROXY.
The Docker setup I used was:
services:
  mitmproxy:
    image: mitmproxy/mitmproxy:11.0.2
    command:
      - mitmdump
      - --listen-host
      - 0.0.0.0
      - --listen-port
      - "8080"
      - --set
      - anticomp=true
      - --set
      - flow_detail=2
      - -s
      - /scripts/anthropic_logger.py
    ports:
      - "8080:8080"
    volumes:
      - ./mitm:/scripts:ro
      - ./logs:/logs
      - ./state:/home/mitmproxy/.mitmproxy
My Claude wrapper was:
export HTTP_PROXY="http://127.0.0.1:8080"
export HTTPS_PROXY="http://127.0.0.1:8080"
export CLAUDE_CODE_HTTP_PROXY="http://127.0.0.1:8080"
export CLAUDE_CODE_HTTPS_PROXY="http://127.0.0.1:8080"
export NODE_EXTRA_CA_CERTS="./state/mitmproxy-ca-cert.pem"

claude --debug-file ./logs/claude-debug.log "$@"
The custom logger:
- Saved raw request and response bodies for
api.anthropic.com. - Redacted sensitive headers like
Authorizationand cookies. - Parsed SSE streams and extracted
usagesnapshots frommessage_startandmessage_delta.
That setup lives in a dedicated repo:
- devforth/claude-proxy-mitm
- docker-compose.yml
- mitm/anthropic_logger.py
- run_claude_via_proxy.sh
- summarize_flows.py
To reproduce:
git clone https://github.com/devforth/claude-proxy-mitm.git
cd claude-proxy-mitm
docker compose up -d

./run_claude_via_proxy.sh \
  --model sonnet \
  --permission-mode bypassPermissions \
  --allowedTools "Bash,Read" \
  -p --output-format json \
  "In your first assistant message, emit exactly two tool calls and no prose before them. The calls are independent and should be issued before seeing either result. Tool call 1: Bash command 'pwd'. Tool call 2: Read file 'package.json'. After both results return, reply with exactly two sections: PWD and PACKAGE_NAME."

./summarize_flows.py
The minimal prompt I used
Once that was working, I wanted the smallest example that still made Claude behave like an agent, not a plain chatbot.
So I used this prompt:
In your first assistant message, emit exactly two tool calls and no prose before them.
The calls are independent and should be issued before seeing either result.
Tool call 1: Bash command 'pwd'.
Tool call 2: Read file 'package.json'.
After both results return, reply with exactly two sections: PWD and PACKAGE_NAME.
That produced a clean trace:
- one hidden Haiku title request
- one Sonnet request that emitted two tool calls in the same assistant response
- one Sonnet request that produced the final answer after both tool results came back
What the real /v1/messages calls looked like
In this minimal run there were three server calls total.
Request 1: hidden Haiku title request
Claude quietly made a title-generation request first:
{
  "model": "claude-haiku-4-5-20251001",
  "messages": [
    {
      "role": "user",
      "content": [
        {
          "type": "text",
          "text": "<session>\nIn your first assistant message, emit exactl ... PWD and PACKAGE_NAME.\n</session>\n\nWrite the title in the language the user wrote in, regardless of the language of the examples above."
        }
      ]
    }
  ]
}
This request really did contain a title-generation instruction. I am not treating that side request as the stats issue here; it just shows up as its own separate real model call.
You can see the same thing from two other angles too:
- Claude's debug log marked the request source as
generate_session_title - the local transcript later stored an
ai-titlerow:
{
  "type": "ai-title",
  "aiTitle": "Execute bash command and read package.json",
  "sessionId": "a4a5d1c5-9b4f-4ab6-96ad-29e5df6ac2a8"
}
Request 2: first Sonnet inference request
The first real Sonnet request was just the user prompt:
{
  "model": "claude-sonnet-4-6",
  "messages": [
    {
      "role": "user",
      "content": [
        {
          "type": "text",
          "text": "In your first assistant message, emit exactly two tool calls and no prose before them. The calls are independent and should be issued before seeing either result. Tool call 1: Bash command 'pwd'. Tool call 2: Read file 'package.json'. After both results return, reply with exactly two sections: PWD and PACKAGE_NAME."
        }
      ]
    }
  ]
}
Request 3: second Sonnet inference request
This was the part I was looking for.
After the first Sonnet response emitted two tool calls, the next Sonnet request body already contained both tool uses and both tool results:
{
  "model": "claude-sonnet-4-6",
  "messages": [
    {
      "role": "user",
      "content": [
        {
          "type": "text",
          "text": "In your first assistant message, emit exactly two tool calls and no prose before them. The calls are independent and should be issued before seeing either result. Tool call 1: Bash command 'pwd'. Tool call 2: Read file 'package.json'. After both results return, reply with exactly two sections: PWD and PACKAGE_NAME."
        }
      ]
    },
    {
      "role": "assistant",
      "content": [
        {
          "type": "tool_use",
          "id": "toolu_01Wz7TaaD29ieCcCKbZdrkuN",
          "name": "Bash",
          "input": {
            "command": "pwd"
          }
        },
        {
          "type": "tool_use",
          "id": "toolu_018C9qTeyftnz8JL6WeHbY5M",
          "name": "Read",
          "input": {
            "file_path": "/home/ivan/code/letmecode/package.json"
          }
        }
      ]
    },
    {
      "role": "user",
      "content": [
        {
          "type": "tool_result",
          "tool_use_id": "toolu_018C9qTeyftnz8JL6WeHbY5M",
          "content": "1\t{\n2\t  \"name\": \"letmecode\",\n3\t  \"version\": \"0.1.15\",\n..."
        },
        {
          "type": "tool_result",
          "tool_use_id": "toolu_01Wz7TaaD29ieCcCKbZdrkuN",
          "content": "/home/ivan/code/letmecode",
          "is_error": false
        }
      ]
    }
  ]
}
This one request body already answers a few things:
- tool results are sent back through
/v1/messages, not only kept in local client state - Claude really does build a larger follow-up prompt and send it back to
/v1/messages - multiple tools can appear in the same assistant turn and then in the same follow-up prompt
What the real /v1/messages responses looked like
Response 1: hidden Haiku title request
event: message_start
data: {"type":"message_start","message":{"model":"claude-haiku-4-5-20251001","id":"msg_01LnaNa3Dwz1LzciyYE6feyx","usage":{"input_tokens":574,"cache_creation_input_tokens":0,"cache_read_input_tokens":0,"output_tokens":5}}}

event: content_block_delta
data: {"type":"content_block_delta","index":0,"delta":{"type":"text_delta","text":"{\"title\": \"Execute"}}

event: content_block_delta
data: {"type":"content_block_delta","index":0,"delta":{"type":"text_delta","text":" bash command and read package.json\"}"}}

event: message_delta
data: {"type":"message_delta","delta":{"stop_reason":"end_turn"},"usage":{"input_tokens":574,"cache_creation_input_tokens":0,"cache_read_input_tokens":0,"output_tokens":16}}
The actual emitted text payload here was:
{"title": "Execute bash command and read package.json"}What showed up in local jsonl right after that was not a normal assistant turn, but an ai-title metadata row:
{
  "type": "ai-title",
  "aiTitle": "Execute bash command and read package.json",
  "sessionId": "a4a5d1c5-9b4f-4ab6-96ad-29e5df6ac2a8"
}
So the client records the generated title, but in local jsonl I do not see a normal assistant row with message.usage for this Haiku request. It is represented as title metadata, not as an ordinary transcript event.
Response 2: first Sonnet response with two tool calls
This is the response that made the mismatch click for me.
One single HTTP response stream emitted two tool calls:
event: message_start
data: {"type":"message_start","message":{"model":"claude-sonnet-4-6","id":"msg_01Bfx5QqsejiNrgQdATW146i","usage":{"input_tokens":3,"cache_creation_input_tokens":6430,"cache_read_input_tokens":16294,"output_tokens":5}}}

event: content_block_start
data: {"type":"content_block_start","index":0,"content_block":{"type":"tool_use","id":"toolu_01Wz7TaaD29ieCcCKbZdrkuN","name":"Bash","input":{},"caller":{"type":"direct"}}}

event: content_block_delta
data: {"type":"content_block_delta","index":0,"delta":{"type":"input_json_delta","partial_json":"{\"command\": \"pwd"}}

event: content_block_delta
data: {"type":"content_block_delta","index":0,"delta":{"type":"input_json_delta","partial_json":"\"}"}}

event: content_block_start
data: {"type":"content_block_start","index":1,"content_block":{"type":"tool_use","id":"toolu_018C9qTeyftnz8JL6WeHbY5M","name":"Read","input":{},"caller":{"type":"direct"}}}

event: content_block_delta
data: {"type":"content_block_delta","index":1,"delta":{"type":"input_json_delta","partial_json":"{\"file_path\": \"/home/ivan/code/letmecode/package.json"}}

event: content_block_delta
data: {"type":"content_block_delta","index":1,"delta":{"type":"input_json_delta","partial_json":"\"}"}}

event: message_delta
data: {"type":"message_delta","delta":{"stop_reason":"tool_use"},"usage":{"input_tokens":3,"cache_creation_input_tokens":6430,"cache_read_input_tokens":16294,"output_tokens":101}}
There was no natural-language prose in this response at all. The actual emitted payload was just the two tool JSON inputs:
{"command": "pwd"}
{"file_path": "/home/ivan/code/letmecode/package.json"}
For counting, the visible JSON is not the interesting bit. This was one HTTP response, but the local transcript split it into multiple rows that all carry the same final usage.
And this is exactly how that one real HTTP response got split in local jsonl:
{
  "line": 8,
  "requestId": "req_011CcVdNNYdvWsgt9vHPSKau",
  "message.id": "msg_01Bfx5QqsejiNrgQdATW146i",
  "stop_reason": "tool_use",
  "content": [{"type":"tool_use","name":"Bash","input":{"command":"pwd"}}],
  "usage": {"input_tokens":3,"cache_read_input_tokens":16294,"cache_creation_input_tokens":6430,"output_tokens":101}
}
{
"line": 9,
"requestId": "req_011CcVdNNYdvWsgt9vHPSKau",
"message.id": "msg_01Bfx5QqsejiNrgQdATW146i",
"stop_reason": "tool_use",
"content": [{"type":"tool_use","name":"Read","input":{"file_path":"/home/ivan/code/letmecode/package.json"}}],
"usage": {"input_tokens":3,"cache_read_input_tokens":16294,"cache_creation_input_tokens":6430,"output_tokens":101}
}The repeated fields:
- same
requestId - same
message.id - same
usage - but two separate local rows, because one real assistant response contained two tool blocks
Response 3: final Sonnet response after both tool results
event: message_start
data: {"type":"message_start","message":{"model":"claude-sonnet-4-6","id":"msg_018zETUn8jwfxEpqQMMn4FXs","usage":{"input_tokens":642,"cache_creation_input_tokens":144,"cache_read_input_tokens":22724,"output_tokens":1}}}

event: content_block_delta
data: {"type":"content_block_delta","index":0,"delta":{"type":"text_delta","text":"**"}}

event: content_block_delta
data: {"type":"content_block_delta","index":0,"delta":{"type":"text_delta","text":"PWD**\n/home/ivan/code/letmecode\n\n**PACKAGE_NAME**\nletmecode"}}

event: message_delta
data: {"type":"message_delta","delta":{"stop_reason":"end_turn"},"usage":{"input_tokens":642,"cache_creation_input_tokens":144,"cache_read_input_tokens":22724,"output_tokens":29}}
The actual final emitted text was:
**PWD**
/home/ivan/code/letmecode

**PACKAGE_NAME**
letmecode
And this is what the local transcript stored around that second Sonnet request:
{
  "line": 10,
  "type": "user",
  "content": [{"tool_use_id":"toolu_018C9qTeyftnz8JL6WeHbY5M","type":"tool_result","content":"1\t{ ... package.json ... }"}]
}
{
"line": 11,
"type": "user",
"content": [{"tool_use_id":"toolu_01Wz7TaaD29ieCcCKbZdrkuN","type":"tool_result","content":"/home/ivan/code/letmecode"}]
}{
"line": 12,
"requestId": "req_011CcVdNZHoNHLJAGw3ubMqS",
"message.id": "msg_018zETUn8jwfxEpqQMMn4FXs",
"stop_reason": "end_turn",
"content": [{"type":"text","text":"**PWD**\n/home/ivan/code/letmecode\n\n**PACKAGE_NAME**\nletmecode"}],
"usage": {"input_tokens":642,"cache_read_input_tokens":22724,"cache_creation_input_tokens":144,"output_tokens":29}
}By this point, three details stood out:
- The first Sonnet response emits two
content_block_starttool_use blocks before it stops. - The local transcript stores those tool blocks as separate rows, but copies the same final
usageonto both of them. - The final answer arrives under a different
requestId, which is exactly what you would expect from a new real model call.
The debug log showed the two tools were really dispatched together
Claude's own debug log around the first Sonnet response looked like this:
2026-06-28T12:05:37.177Z [INFO] [Stall] tool_dispatch_start tool=Bash toolUseId=toolu_01Wz7TaaD29ieCcCKbZdrkuN
2026-06-28T12:05:37.208Z [INFO] [Stall] tool_dispatch_start tool=Read toolUseId=toolu_018C9qTeyftnz8JL6WeHbY5M
2026-06-28T12:05:37.224Z [INFO] [Stall] tool_dispatch_end tool=Read toolUseId=toolu_018C9qTeyftnz8JL6WeHbY5M
2026-06-28T12:05:37.301Z [INFO] [Stall] tool_dispatch_end tool=Bash toolUseId=toolu_01Wz7TaaD29ieCcCKbZdrkuN
So this was not "Claude called Bash, waited, then later decided to call Read."
It emitted both tool calls first, and then both tools were dispatched from that same assistant turn.
One detail worth separating: the visible input_json_delta fragments are not the whole output being counted inside that 101. The Anthropic streaming docs show that those deltas only update the tool_use.input field. The final message_delta.usage belongs to the whole assistant turn, including hidden tool-use structure and overhead, not just the tiny JSON fragments you can see on screen. So I read 101 as "the total output for that assistant turn," not as "the size of the visible JSON." In repeated captures, this did not look like thinking overhead.
What the proxy summary showed
The proxy summary for this experiment was:
Request paths:
   3  /v1/messages?beta=true

Traces:
- ... POST /v1/messages?beta=true model=claude-haiku-4-5-20251001
  usage[message_start] in=574 out=5 cache_read=0 cache_create=0
  usage[message_delta] in=574 out=16 cache_read=0 cache_create=0

- ... POST /v1/messages?beta=true model=claude-sonnet-4-6
  usage[message_start] in=3 out=5 cache_read=16294 cache_create=6430
  usage[message_delta] in=3 out=101 cache_read=16294 cache_create=6430

- ... POST /v1/messages?beta=true model=claude-sonnet-4-6
  usage[message_start] in=642 out=1 cache_read=22724 cache_create=144
  usage[message_delta] in=642 out=29 cache_read=22724 cache_create=144
The proxy trace lines up with the local files:
- Claude makes a hidden Haiku call just to generate the session title.
- The first Sonnet response is one real HTTP request that emits two tool calls.
- The final answer is a separate second Sonnet request after tool results are appended.
The proxy-captured server request IDs matched those exact local requestId values.
For the stats mismatch, this is the important bit:
- when Claude makes a new real model call, I see a new request ID
- when Claude emits multiple tool blocks inside one real model call, the local transcript may split that one response into multiple rows with the same
requestId,message.id, andusage
That is exactly the kind of data shape that makes raw local summation overcount.
One response, one cumulative usage counter
Look again at the live HTTP capture for the first Sonnet response with two tool calls:
usage[message_start] in=3 out=5 cache_read=16294 cache_create=6430
usage[message_delta] in=3 out=101 cache_read=16294 cache_create=6430
That is one API response stream. According to the Anthropic streaming docs, the token counts in message_delta.usage are cumulative for that stream, and the input_json_delta events only describe updates to the tool_use.input field.
And the matching local jsonl rows did not store 105.
They stored 101.
The accounting version:
5was an early usage snapshot101was a later usage snapshot for the same request- the per-request final output for that response is
101, not5 + 101
It is the same counter seen at two different moments during the same response.
If you were using the raw Messages API directly, the number you would use for accounting on that response is the final cumulative message_delta.usage value, which here was 101. If the client later copies that same final usage onto multiple local transcript rows, the local raw sum grows quickly.
What I think is happening
This is the explanation that fits the evidence best for me:
- Claude's local stats are based on raw local transcript rows.
- Those transcript rows may repeat the same cumulative
usagesnapshot across multiple row types (thinking,text,tool_use, maybe others). - Raw summation therefore inflates output totals, especially for long tool-heavy sessions.
- Any local-audit tool, including LetMeCode, should not treat every local row as a separate API generation event.
Put more directly:
Claude local stats look much closer to "sum of transcript usage rows" than to "sum of real distinct model generations."
What I am not saying
I am not claiming:
- Anthropic's server-side billing engine is wrong
- Anthropic invoices necessarily use this same overcounted local method
- every dedup heuristic is automatically correct
What I am saying is narrower:
On Claude Code 2.1.195, the local stats pipeline appears to overcount output tokens by a lot in this real-world dataset.
How to reproduce the problem yourself
1. Compare local stats cache with raw transcript sums
sed -n '136,148p' ~/.claude/stats-cache.jsonpython - <<'PY'
import json
from pathlib import Path
base = Path.home() / ".claude/projects"
output_sum = 0
for path in base.rglob("*.jsonl"):
if "subagents/workflows" in str(path):
continue
for line in path.read_text().splitlines():
if not line.strip():
continue
row = json.loads(line)
msg = row.get("message") or {}
usage = msg.get("usage") or {}
if msg.get("model") == "claude-opus-4-8":
output_sum += usage.get("output_tokens", 0) or 0
print(output_sum)
PY2. Hunt for exact duplicate usage groups
python - <<'PY'
import json
from pathlib import Path
from collections import defaultdict

base = Path.home() / ".claude/projects"
groups = defaultdict(int)

for path in base.rglob("*.jsonl"):
    if "subagents/workflows" in str(path):
        continue
    for line in path.read_text().splitlines():
        if not line.strip():
            continue
        row = json.loads(line)
        msg = row.get("message") or {}
        usage = msg.get("usage") or {}
        key = (
            msg.get("model"),
            row.get("requestId"),
            msg.get("id"),
            usage.get("input_tokens"),
            usage.get("cache_read_input_tokens"),
            usage.get("cache_creation_input_tokens"),
            usage.get("output_tokens"),
        )
        groups[key] += 1

dupes = [(k, c) for k, c in groups.items() if c > 1 and k[0] == "claude-opus-4-8"]
dupes.sort(key=lambda x: x[1], reverse=True)
print(dupes[:10])
PY
3. Watch the real HTTP calls
git clone https://github.com/devforth/claude-proxy-mitm.git
cd claude-proxy-mitm
docker compose up -d
./run_claude_via_proxy.sh \
  --model sonnet \
  --permission-mode bypassPermissions \
  --allowedTools "Bash,Read" \
  -p --output-format json \
  "In your first assistant message, emit exactly two tool calls and no prose before them. The calls are independent and should be issued before seeing either result. Tool call 1: Bash command 'pwd'. Tool call 2: Read file 'package.json'. After both results return, reply with exactly two sections: PWD and PACKAGE_NAME."
./summarize_flows.py
If the "same request ID can hide many real model calls" theory were true in the way needed to explain the large duplicate groups, this is where it should have shown up.
It did not.
Where I landed
The annoying part is that Claude's local stats look more official than a third-party tool, so they are easy to trust.
But in this case, the official-looking number was not the one I trusted by the end.
What changed my mind was:
- local JSONL rows
- exact duplicate usage snapshots
- and real HTTP traces
Once those three lined up, the local /usage number looked overcounted to me.