How to simply workaround RAM-leaking libraries like Puppeteer. Universal way to fix RAM leaks once and forever


RAM leaks is very common problem which happens in a big amount of external libraries. They might work perfectly, have a lot of downloads on NPM and stars on the GitHub. Nevertheless, all of these does not really save them from RAM leaks on a long run. Especially if they have some underlying native bindings. Library can be unreplaceable in own niche, have very simple API, and satisfy you in all other aspects but consume more and more RAM when you use it in long-running process.
For example, one of the most popular cases here are all libraries which are based on headless Chromium. One of them is very popular Nodejs package called puppeteer which is a great tool for crawling, user-imitation and testing tasks. This library is API-controlled wrapper over Chromium which allows you to load page, walk through selectors, make some clicks on site or enter some values in inputs on page. But when you use it in a long-running process your server monitoring tool starts reporting "RAM is almost full". Having lack of RAM on server is a terrible thing because it activates operation system's out-of-memory killer who starts killing any processes randomly causing service downtime or even touching system processes which destroy server connectivity until full reboot.

Another challenge is to find which code or library caused the leak in your app. What you might get is a huge amount of RAM reported by htop utility after couple of days of your process uptime and you will have no clues what caused it. There are reliable methods to understand it but we will not cover them in this post. Basically, assumptions and suspicions based on developer's experience in combination with code experiments work here as well.
In this post I will show how you can easily overcome such problems by using child processes. We will make some simple experiments which confirm RAM leaks and then show how to workaround them. The fix described here could be adopted to absolutely any issue caused by RAM leaks in external imported library, including casing when you need to pass data to/from child process.
Code which leaks
First of all start a new NPM project and install puppeteer:
npm init
npm i puppeteer
For me this code installed latest version which is 14.2.1 (you can check this in package.json). In future versions of Puppeteer or underlying Chrome probably RAM leak will receive appropriate true fix, but assuming how long this issue is there, I think it might never happen. Also most Chrome-based libraries like CEF were always leaky.
Also, as always, I added "type": "module", to my package.json so my nodejs (v16) will have imports support.
Now create an index.js file:
import puppeteer from 'puppeteer'
async function run() {
let i = 0;
const browser = await puppeteer.launch({ args: ['--no-sandbox', '--disable-setuid-sandbox'] });
while(true) {
const page = await browser.newPage();
try {
await page.goto('https://www.airbnb.com/', {waitUntil: 'networkidle2'});
const buttonTitle = await page.evaluate(() => {
return document.querySelector('[href="/host/homes"]').innerText;
});
if (buttonTitle !== 'Become a Host') {
console.error('Was not able to load a page')
}
console.log('👌🏼 Page loaded', i++)
} catch {
console.log('🙅🏼♀️ Page did not load', i++)
} finally {
await page.close();
}
}
await browser.close(); // never executes
}
run();
Code creates one browser instance using puppeteer.launch and then creates a page in every iteration of the loop, navigates this page to Airbnb website and looks for a tag with href which is equal to "/host/homes". This is an anchor to "becoming a host" page, and our code verifies that title is correct. In this way we make sure that we are able to fully load a page in all our experiments and get some feedback from that page.
How to measure process RAM consumption
First of all we will always start node process using fake argument --tagprocess which will be ignored by NodeJS and by our script but will allow us to reliably filter out our processes in output of ps:
node index.js --tagprocess
Now we can run simple ps aux to get RAM used by our process:
ps aux | grep 'tagprocess\|USER'  | grep -v grep
USER       PID %CPU %MEM    VSZ   RSS TTY      STAT START   TIME COMMAND
ivan      6852 44.8  0.3 11155244 105716 pts/10 Sl+ 11:33   5:53 node index.js --tagprocess
There are two interesting fields in the output related to memory:
- VSZ - Virtual Memory Size. This is the size of memory that Linux has given to our process, but it doesn’t necessarily mean that the process is using all of that memory.
- RSS is Resident Set Size. This is the size of memory that a process has currently used to load all of its pages. Always represented in KiB.
So most interesting for us is RSS
Important fact: RSS value might be a little bit overestimated because it counts memory occupied by all shared libraries used by process. In fact if there is other process which also uses same shared library then Linux avoids reloading a duplicate copy of the library into RAM, and just shares the same copy that the first application is using. But it will not hurt our experiments
To automate measuring I created a simple script: here is it: Measure RAM consumption of any process with --tagprocess argument and show count of such processes. Left blue axis shows total RAM consumption of all processes that are now being executing with fake input argument --tagprocess. Red right bar shows number of processes with this tag.
In this experiment check memory consumption of node process:
node drawRamOnChart.js 'tagprocess'
Here is what I got:
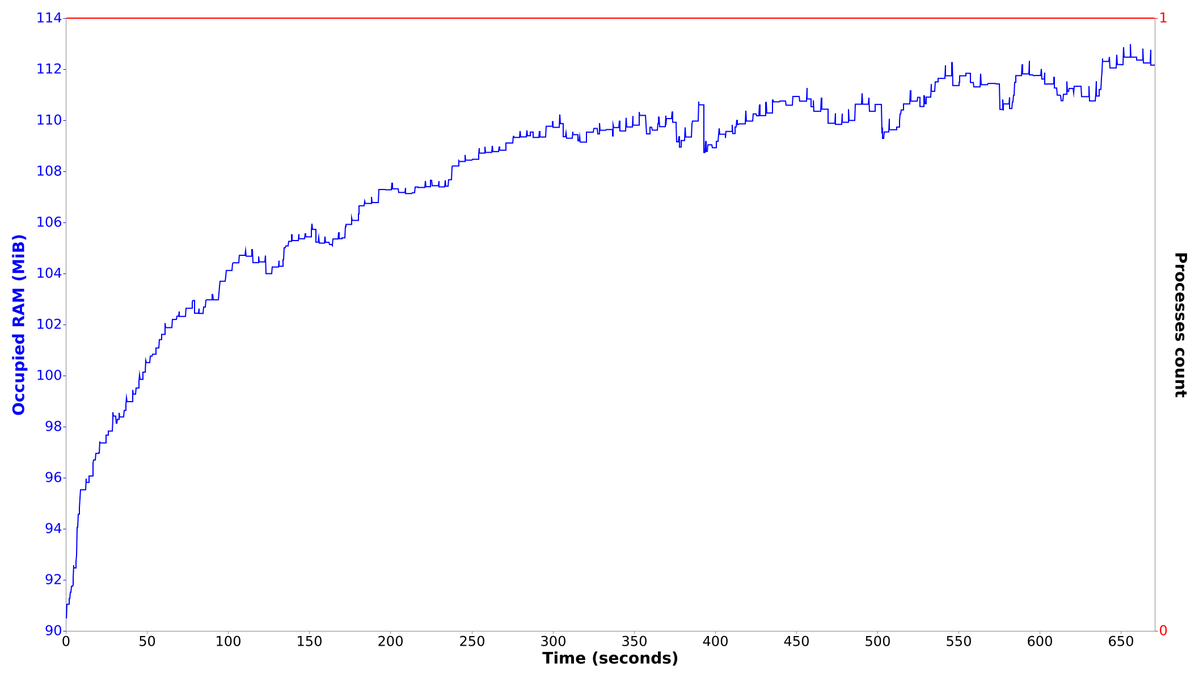
For the 10 minutes reflected on chart, our code made more then 200 page loads. By building a trend line across minimal RAM points in a smaller intervals you can recognize a leak even on such a short period of time. We spent only 10 minutes and RAM consumption minimum level permanently increases.
But let's consider more interesting story. To present you concrete proof of leak I created a code snippet which I can run for a longer time:
import puppeteer from 'puppeteer'
import fs from "fs";
import { parse } from "csv-parse";
const websites = [];
fs.createReadStream("./top-1m.csv")
.pipe(parse({ delimiter: ",", from_line: 1 }))
.on("data", function (row) {
websites.push(row[1]);
})
function getRandomWebsite() {
return websites[Math.floor(Math.random()*websites.length)]
}
async function run() {
let i = 0;
const browser = await puppeteer.launch({ args: ['--no-sandbox',] });
while(true) {
const page = await browser.newPage();
try {
await page.goto(`https://${getRandomWebsite()}`, {waitUntil: 'load', timeout: 500});
await page.screenshot({path: 'file.png'});
console.log('👌🏼 Page loaded', i++)
} catch {
console.log('🙅🏼♀️ Page did not load', i++)
} finally {
await page.close();
}
}
await browser.close(); // never executes
}
run();
The snippet uses one million of top websites according to Alexa rank. In loop I just get random website and try to load it within half of a second in a new page which get's closed in each iteration of the loop. While I don't want to fetch Airbnb website for an hours, I can safely do requests to random websites.
Let's profile memory consumption on both node process and chrome processes spawned by puppeteer:
node drawRamOnChart.js 'tagprocess|chrome'
Let's consider first ~1.5 hours of this script:
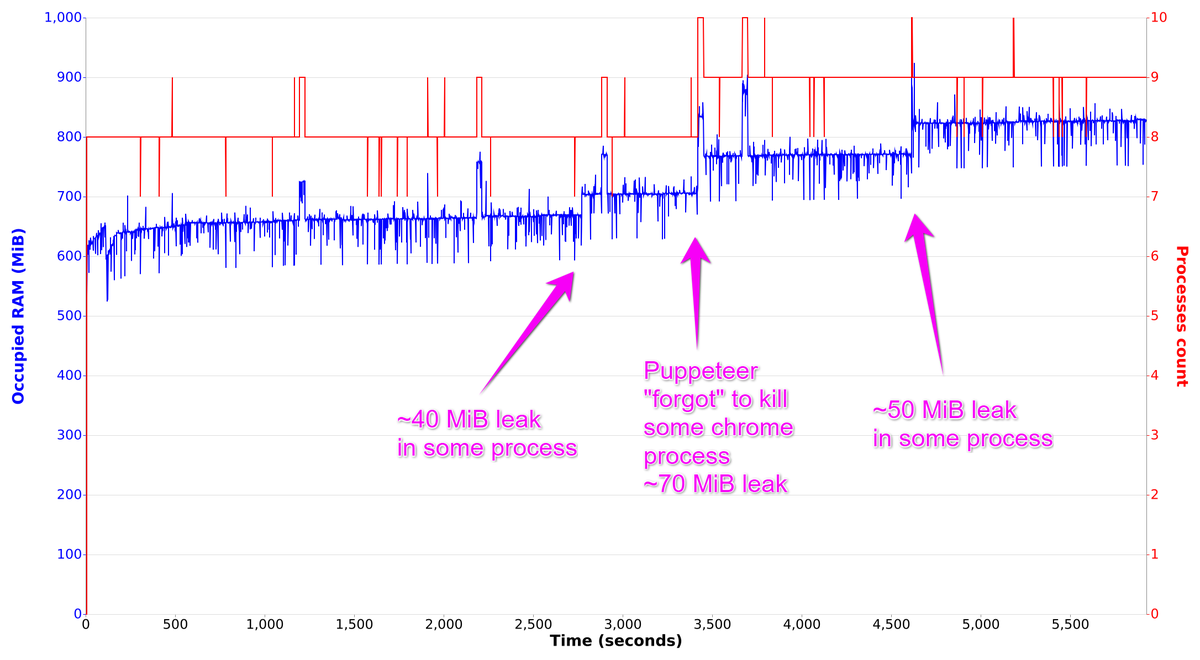
Apart of "dramatic" memory jumps we can also notice constant slow memory increase.
You might notice that we have only one instance of browser created by puppeteer.launch and then in loop we create a page and close it. You might think that probably memory leak will go away if we will try to recreate browser. Well, let's try it:
import puppeteer from 'puppeteer'

async function run() {
  let i = 0;
  while(true) {
    const browser = await puppeteer.launch({ args: ['--no-sandbox', '--disable-setuid-sandbox'] });
    const page = await browser.newPage();
    try {
      await page.goto('https://www.airbnb.com/', {waitUntil: 'networkidle2'});
      const buttonTitle = await page.evaluate(() => {
        return document.querySelector('[href="/host/homes"]').innerText;
      });
      if (buttonTitle !== 'Become a Host') {
        console.error('Was not able to load a page')
      }
      console.log('🎉 Request made', i++)
    } catch {
      console.log('😭 Request failed', i++)
    } finally {
      await page.close();
      await browser.close();
    }
  }
}

run();
Here is RAM consumption for this script:
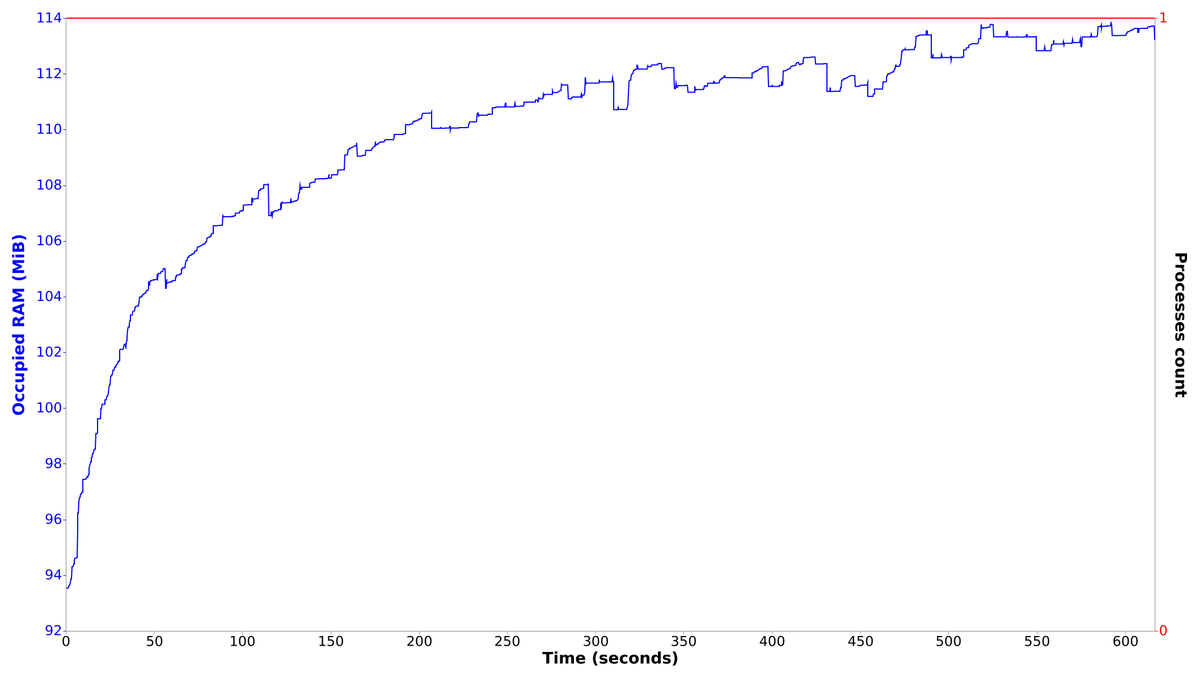
As we can see leak is still there.
Universal fix for RAM leaks issues
So here is a very simple idea which works great in all such cases: Instead of importing and using library in your main process, you move the Puppeteer calls completely to a small child process. After task is done, child process exits completely and releases all consumed RAM. There is no leak in parent process because it even does not import leaking library.
There are 3 main challenges here:
- We need to know how to run child process with a full RAM decoupling from parent
- We need to pass input data to a child process
- We need to get output data back
Second and third points should be resolved through a mechanisms of Inter Process Communication. There are different options to organize IPC, but we will use simplest ones, and in same time pretty compatible with majority of tasks.
So here is a solution. Create a file called puWorker.js:
import puppeteer from 'puppeteer'

// WARNING: don't use console.log here for debug, use console.error instead. STDOUT is used to deliver output data

// find value of input process argument with --input-data

const inpDataB64 = process.argv.find((a) => a.startsWith('--input-data')).replace('--input-data', '')
const inputData = JSON.parse(Buffer.from(inpDataB64, 'base64').toString())

const browser = await puppeteer.launch({ args: ['--no-sandbox', '--disable-setuid-sandbox',] });
const page = await browser.newPage();

await page.goto(inputData.url, {waitUntil: 'networkidle2'});

const buttonTitle = await page.evaluate(({ inputData }) => {
  return document.querySelector(inputData.selectorToGet).innerText;
}, { inputData });

const outputData = {
  buttonTitle: buttonTitle,
}

await page.close();
await browser.close();

console.log(JSON.stringify(outputData))  // print out data to STDOUT
Change our index.js file to this one:
import { spawn } from 'child_process';
import path from 'path';
const __dirname = path.resolve();

async function runPupeteer(data) {
  const jsonData = JSON.stringify(data)
  const b64Data = Buffer.from(jsonData).toString('base64');
  let stdoutData = '';
  return await new Promise((resolve) => {
    const proc = spawn('node', [
      path.resolve(__dirname, 'puWorker.js'),
      `--input-data${b64Data}`,
      '--tagprocess'
    ], { shell: false });
    proc.stdout.on('data', (data) => {
      stdoutData += data;
    });
    proc.stderr.on('data', (data) => {
      console.error(`NodeERR: ${data}`);
    });
    proc.on('close', async (code) => {
    });
    proc.on('exit', function () {
      proc.kill();
      resolve(JSON.parse(stdoutData));
    });
  });
}

async function run() {
  let i = 0;
  while(true) {
    const resData = await runPupeteer({
      url: 'https://www.airbnb.com/',
      selectorToGet: '[href="/host/homes"]',
      i,
    });
    if (resData.buttonTitle !== 'Become a Host') {
      console.error('Was not able to load a page')
    }
    console.log('🎉 Request made', i++)
  }
}

run();
Let's profile it:
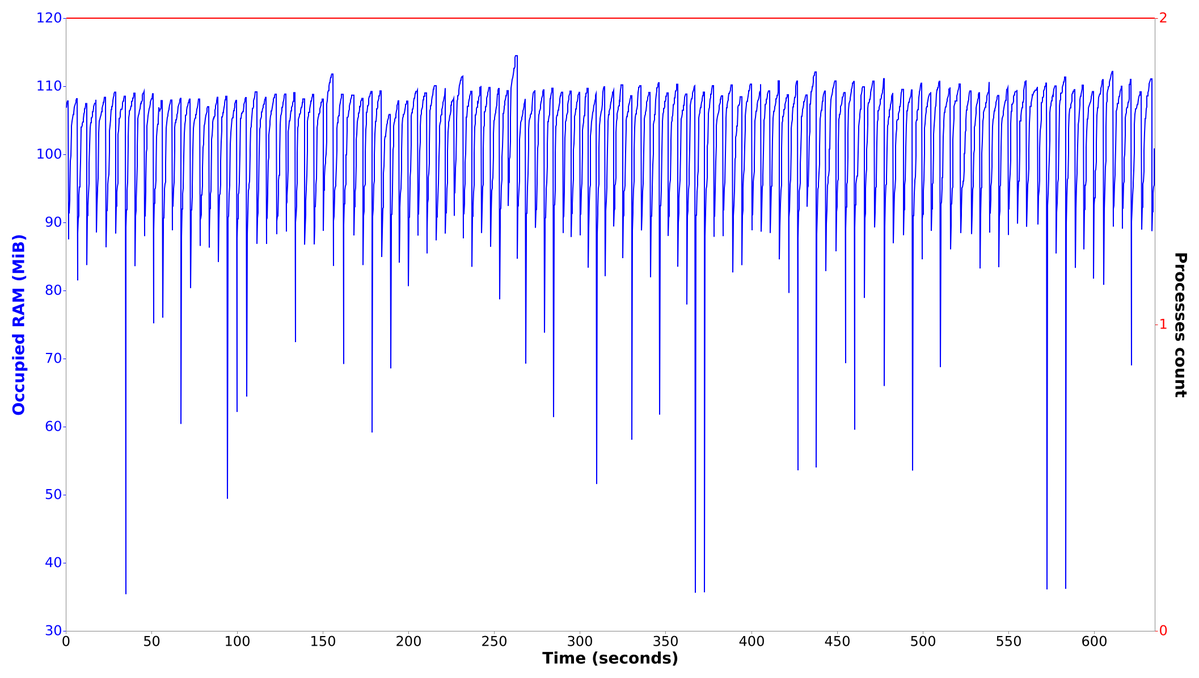
Difference is obvious 😎. Time from time we see needles which lower the used RAM down.

Now couple of comments regarding to the code. For passing input data we used simple CLI argument. To be capable with any kind of data, I encode it with JSON and Base64. This is enough for most tasks, however we should remember that there is a command length limit, which is near 8 KiB in Linux. If you have to pass larger amounts of data you can save it to some temporary file and pass only filename, like we do it in Scriptimate. To deliver data back we just print JSON to STDOUT.
This is it. Stay stable, stay low RAM, write sweet code and the main thing: russians go to hell with their f*king war